Swing trading is all about capturing those sweet price swings that happen over a few days or weeks, but the key to doing it successfully lies in timing your entries and exits perfectly.
So, how do you pinpoint those critical moments?
Enter Fibonacci levels—one of the most trusted tools in a swing trader’s toolbox.
Whether you’re a beginner or an experienced trader, understanding how to use these golden ratios can give you an edge in identifying potential reversals and profit-taking points.
In this blog, we’ll explore how Fibonacci levels help swing traders make smarter decisions by providing a roadmap for spotting trends, reversals, and optimal entry/exit points.
Ready to unlock the power of Fibonacci in your swing trading strategy?
Let’s dive in!
What is Swing Trading?
Swing trading is a trading strategy where traders look to capitalize on price swings in the market. These swings can last from a few days to several weeks.
The idea is to buy an asset when it’s expected to rise in price and sell it when it reaches its peak, or vice versa, sell an asset when it’s expected to fall and buy it back when it hits a low.
The goal of swing trading is to capture a portion of the potential price movement. Swing traders typically rely on technical analysis, studying price charts, patterns, and indicators to make informed decisions.
To Understand in detail about Swing Trading .Go to : Swing Trading : Learn About Most Profitable Trading Type
Understanding Fibonacci Levels
Who Was Fibonacci?
Leonardo Fibonacci, an Italian mathematician from the 13th century, is renowned for introducing the Fibonacci sequence to the Western world.
This sequence begins with 0 and 1, and each subsequent number is the sum of the two preceding ones: 0, 1, 1, 2, 3, 5, 8, 13, and so on.
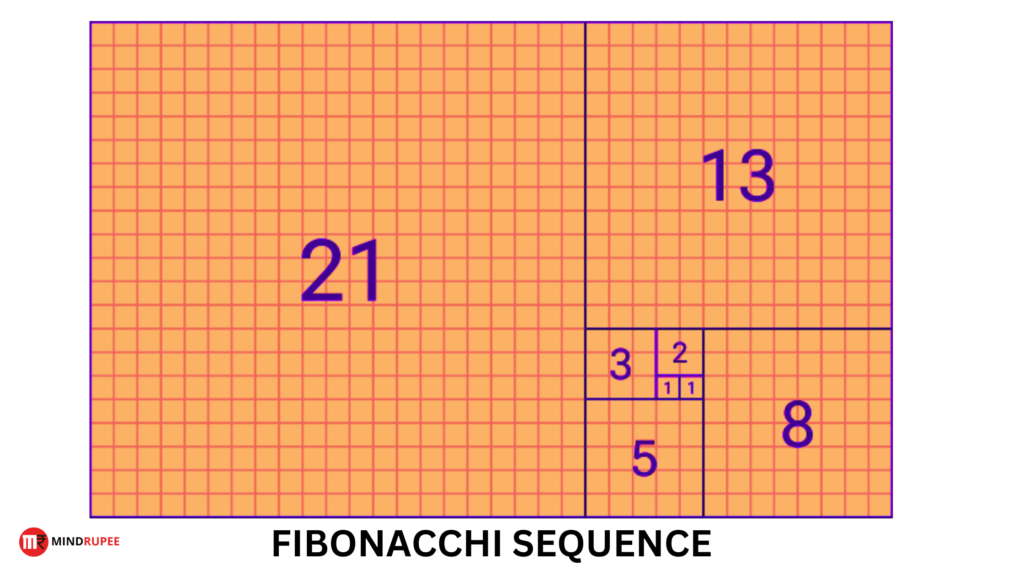
While Fibonacci originally used this sequence to solve problems related to the growth of rabbit populations, its application in various fields, including stock market analysis, has made it a key tool in modern trading strategies.
Fibonacci levels have become popular for identifying potential price movements and retracement levels in financial markets.
Fibonacci Retracement Levels
Fibonacci retracement levels are key ratios derived from the Fibonacci sequence that traders use to predict areas of support and resistance.
These levels are particularly effective in swing trading, where identifying potential pullback levels in an ongoing trend is crucial.
The primary Fibonacci retracement levels include 23.6%, 38.2%, 50%, 61.8%, and 78.6%.
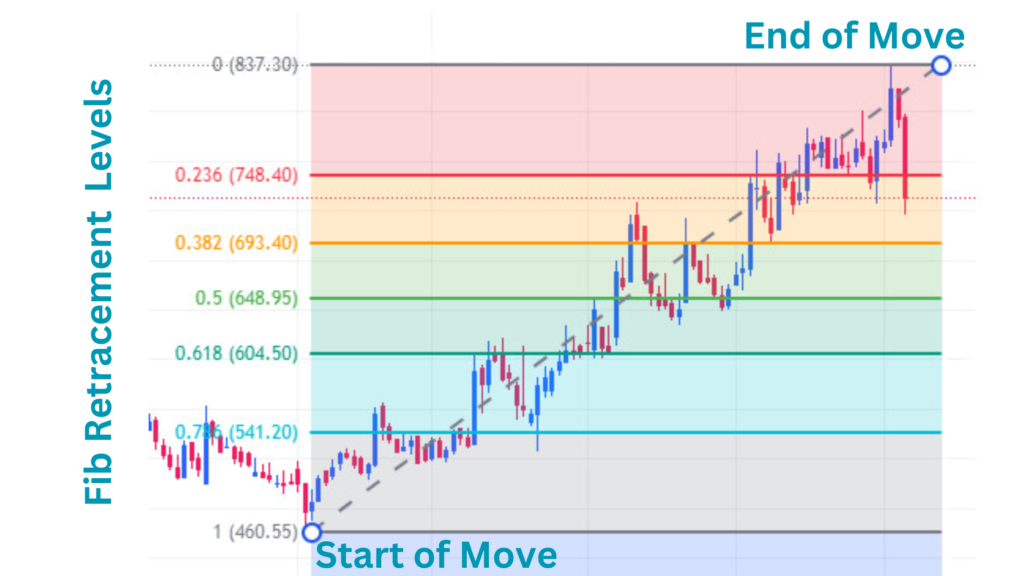
Among these, 38.2% and 61.8% are considered the most significant, with 50% also frequently used, although it’s not an official Fibonacci number but a key psychological level.
These retracement levels are calculated by measuring the vertical distance between a significant high and a significant low on a price chart and applying the Fibonacci ratios to that range.
The retracement levels are then plotted horizontally on the chart, representing potential support or resistance levels where the price could reverse or consolidate.
For example:
- If a stock moves from ₹200 (swing low) to ₹300 (swing high), the price range is ₹100.
- A 38.2% retracement would be ₹38.2 (100 × 0.382), which, when subtracted from ₹300, gives ₹261.8 as a potential support level.
Key Retracement Levels
- 23.6% Retracement: Indicates a shallow pullback and suggests a continuation of the current trend with minimal disruption.
- 38.2% Retracement: A moderate pullback, often marking a solid support or resistance level.
- 50% Retracement: Not a true Fibonacci number, but a common level where traders expect a halfway correction in the move.
- 61.8% Retracement: The “golden ratio,” a critical level that often represents a strong pullback within the trend.
- 78.6% Retracement: A deeper retracement that still suggests potential continuation of the trend.
Fibonacci Extensions
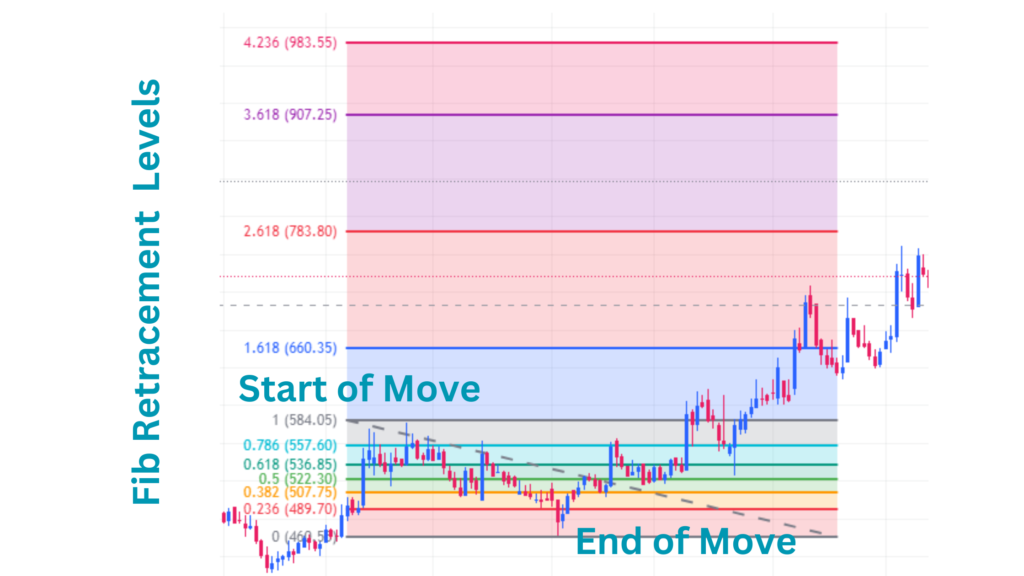
Fibonacci extensions are used by traders to predict potential price targets when the price moves beyond the initial retracement levels. These levels are especially useful in identifying potential profit-taking zones in trend-following trades.
The most commonly used Fibonacci extension levels include 127.2%, 161.8%, 200%, and 261.8%. These levels are calculated by taking the price range between a swing high and swing low, and then extending that range by applying the Fibonacci ratios to predict how far the price may continue in the direction of the trend after a retracement.
Key Extension Levels
- 127.2% Extension: Often the first level of target projection after a retracement, representing a moderate continuation of the trend.
- 161.8% Extension: Known as the golden ratio, this is a critical target level for swing traders anticipating further trend continuation.
- 200% and 261.8% Extensions: Represent more aggressive price targets, indicating stronger momentum or trend continuation, often observed in parabolic moves or strong trending markets.
Swing traders use Fibonacci retracement and extension levels to predict potential areas where price pullbacks may reverse or extend.
The retracement levels help traders identify low-risk entry points during a correction within an overall trend, while the extension levels help set profit targets once the price resumes its original direction. Combined with other technical analysis tools, Fibonacci levels offer traders a strategic advantage by anticipating price movements and making informed trading decisions.
Why is 61.8 a Golden Ratio?
The 61.8% ratio, often referred to as the “Golden Ratio” or “Phi,” is a mathematical concept deeply rooted in nature, art, architecture, and financial markets.
It is derived from the Fibonacci sequence and holds significant importance in technical analysis, particularly in trading.
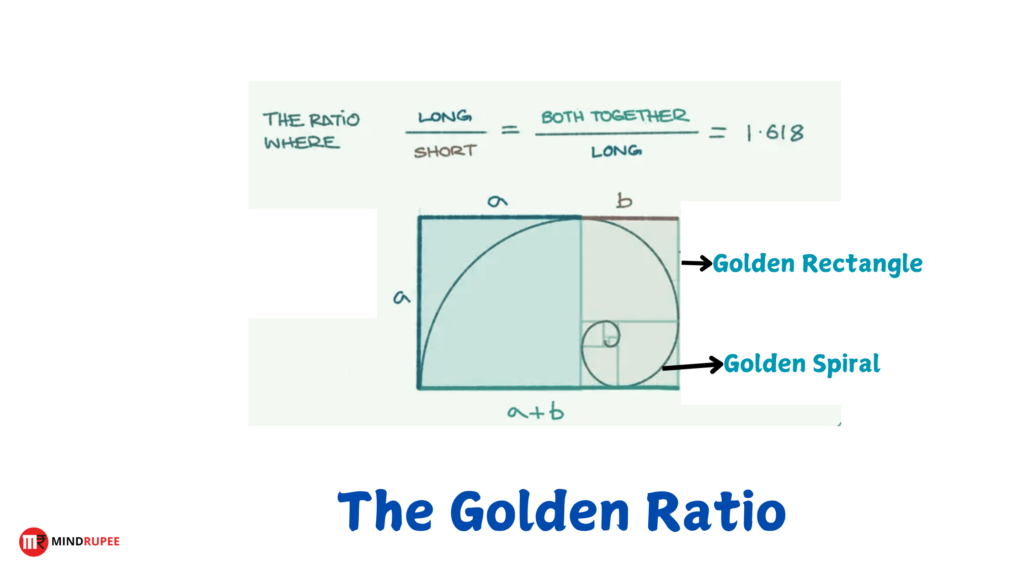
Here’s why the 61.8% level is referred to as the “Golden Ratio”:
Mathematical Origin
The Golden Ratio (Phi) is approximately 1.618, and its inverse is 0.618, or 61.8%. This ratio appears when you divide a number in the Fibonacci sequence by the number that immediately follows it. For example:
- 89 ÷ 144 ≈ 0.618
- 144 ÷ 233 ≈ 0.618
As the Fibonacci numbers increase, the ratio between any number and its successor converges toward 0.618.
Natural and Universal Occurrence
The Golden Ratio is found in many natural phenomena and structures. For instance, the ratio appears in:
- The arrangement of leaves around a stem.
- The spirals of shells.
- The patterns of galaxies.
- The proportions of the human body.
This widespread occurrence in nature suggests that 61.8% is a fundamental ratio governing balance and proportion.
Golden Ratio in Art and Architecture
Artists and architects throughout history have used the Golden Ratio to create aesthetically pleasing compositions. The Parthenon in Greece, Leonardo da Vinci’s “Vitruvian Man,” and many classical paintings use this ratio to achieve balance and harmony. This cultural significance adds to the mystique and universal appeal of 61.8%.
Golden Ratio in Trading
In financial markets, the 61.8% retracement level is crucial because of its psychological impact and its predictive power. Many traders believe that market movements and investor behavior often follow the Fibonacci ratios, with the 61.8% retracement level acting as a critical point where price tends to reverse or pause.
In swing trading, when a stock or asset retraces 61.8% of its previous move, it often signifies a key support or resistance level, where the price may reverse direction. Traders use this as a signal to enter or exit trades, anticipating a reaction at this pivotal level.
The Golden Ratio in Market Sentiment
The Golden Ratio’s significance extends to market sentiment. Investor psychology often drives market prices to adhere to Fibonacci retracement levels, particularly the 61.8% level. This occurs because collective behaviors tend to follow patterns, and traders react to price movements that approach these Fibonacci levels, causing the self-fulfilling nature of price reversals around the Golden Ratio.
The 61.8% level is called the Golden Ratio because it is a universal constant that appears in various aspects of life, from natural patterns to human behavior and financial markets. In trading, it serves as a key level for predicting potential retracements or reversals in price, making it an essential tool for swing traders and technical analysts alike.
Why Fibonacci Levels Matter in Swing Trading?
Fibonacci levels are a powerful tool in swing trading because they help traders identify key price points where market trends are likely to reverse, pause, or continue.
These levels are derived from the Fibonacci sequence and are essential for recognizing support and resistance areas, timing trade entries and exits, and enhancing trading strategies.
Here’s why Fibonacci levels matter:
1. Support and Resistance Identification
One of the most critical aspects of swing trading is determining potential support and resistance levels, and Fibonacci retracement levels excel at this.
When a market experiences a significant price movement—either upward or downward—it tends to pull back or “retrace” before continuing in the direction of the trend.
- Support Levels: Fibonacci retracement levels, particularly the 38.2%, 50%, and 61.8% levels, act as potential support zones during a pullback in an uptrend. If the price falls to one of these levels and holds, it often indicates that the price may bounce back and continue its upward movement.
- Resistance Levels: In a downtrend, these same levels act as resistance, meaning the price could bounce off these levels and continue to move downward. Swing traders use these zones to anticipate when price movements might stall or reverse, allowing them to plan their trades more effectively.
For example, if a stock is rising and begins to pull back, a swing trader might look for the price to reach the 61.8% retracement level, which often acts as a strong support zone where the price could reverse and resume its upward trend.
2. Timing Trade Entries and Exits
In swing trading, timing is crucial for maximizing profits and minimizing losses. Fibonacci levels provide traders with key areas to enter and exit trades, helping them make more informed decisions about when to buy or sell.
- Entering Trades: Swing traders often use Fibonacci retracement levels to identify optimal entry points during pullbacks. For example, if a stock has been in an uptrend and pulls back to the 50% retracement level, a trader might view this as a good opportunity to enter a long position, anticipating that the price will rebound and continue its upward movement.
- Exiting Trades: Conversely, Fibonacci extension levels (such as 161.8%, 261.8%) help traders set profit targets. These levels indicate where the price may reach after breaking through previous resistance levels. By using these extensions, swing traders can strategically exit positions to capture profits at key levels where the price is likely to reverse or consolidate.
Example: A trader notices that a stock is in an uptrend and pulls back to the 38.2% retracement level, which often serves as a minor support level. They enter the trade at this point, aiming to ride the price back to its previous high.
They might set a stop-loss just below the 50% level to manage risk and use Fibonacci extensions to set a profit target around the 161.8% level.
3. Enhancing Risk Management
Fibonacci levels also help swing traders manage risk more effectively.
By identifying key support and resistance zones, traders can set their stop-loss orders strategically just beyond these levels, ensuring that if the price moves against them, their losses are minimized.
For example, if a trader enters a position at the 61.8% retracement level, they might place a stop-loss just below the 76.4% level to limit potential losses in case the price doesn’t hold.
4. Self-Fulfilling Prophecy
Many traders use Fibonacci levels, which creates a self-fulfilling prophecy effect.
Since a large number of market participants expect prices to react at these levels, they place orders around these areas, which often leads to the predicted price reaction.
This widespread use of Fibonacci levels increases their reliability in swing trading.
By understanding and applying Fibonacci retracement and extension levels, swing traders can improve their ability to forecast price movements, identify strong entry and exit points, and manage risk effectively.
These levels offer a structured approach to trading that complements other technical indicators and strategies, making them an essential tool in any swing trader’s toolkit.
Combining Fibonacci Levels with Other Technical Indicators
Fibonacci levels are powerful tools in swing trading, but their effectiveness can be further enhanced when combined with other technical indicators. This combination helps to validate trading signals and provides a more comprehensive approach to market analysis. Here’s how you can combine Fibonacci levels with some of the most popular indicators.
1. Fibonacci and Moving Averages
Moving averages (MAs) are commonly used in swing trading to identify the overall trend and dynamic support or resistance levels. When moving averages align with Fibonacci retracement levels, it strengthens the likelihood of these levels acting as key areas of support or resistance.
- How to Combine: Look for instances where Fibonacci levels (like 38.2% or 61.8%) coincide with a significant moving average, such as the 50-day or 200-day moving average. If price retraces to a Fibonacci level that also lines up with a moving average, this confluence increases the probability that the level will hold.
- Example: Suppose a stock is in an uptrend and retraces to the 38.2% Fibonacci level, which also coincides with the 50-day moving average. This overlap suggests a strong support zone, increasing the likelihood that the stock will bounce and continue its uptrend.
2. Fibonacci and RSI (Relative Strength Index)
The Relative Strength Index (RSI) is a momentum indicator that measures whether an asset is overbought or oversold. Combining Fibonacci retracement levels with RSI can give traders a better sense of whether the retracement level will hold or if a reversal is imminent.
- How to Combine: When the price approaches a key Fibonacci level (such as 38.2% or 61.8%) and the RSI is in overbought or oversold territory, it can signal that the price is likely to reverse. This adds an extra layer of confirmation to your Fibonacci-based trade.
- Example: If a stock retraces to the 61.8% Fibonacci level and the RSI is in oversold territory (below 30), this suggests that the stock is likely to bounce back, offering a good entry point for a long position.
3. Fibonacci and Trendlines
Trendlines are essential in swing trading as they help identify the direction of the market. When a Fibonacci retracement level aligns with a well-established trendline, it provides an additional confirmation of a potential reversal or continuation.
- How to Combine: Use trendlines to confirm the direction of the trend, and watch for price retracements to key Fibonacci levels. If a Fibonacci level aligns with a trendline, it strengthens the support or resistance area, making it a high-probability trade setup.
- Example: Imagine a stock in an uptrend with a strong upward trendline. If the stock retraces to the 50% Fibonacci level, and this level is also near the upward trendline, it suggests a likely bounce from that level, making it a great entry point for a long position.
Benefits of Combining Fibonacci Levels with Other Indicators
- Higher Accuracy: By combining Fibonacci levels with other indicators, traders can confirm the validity of support or resistance levels, leading to more accurate trade setups.
- Better Timing: Indicators like RSI and moving averages can help identify overbought or oversold conditions, ensuring traders enter or exit trades at the most opportune moments.
- Enhanced Risk Management: Using multiple tools helps traders avoid false signals and manage their risk more effectively by ensuring that they only trade when multiple indicators confirm a trend or reversal.
Combining Fibonacci levels with moving averages, RSI, and trendlines provides a more well-rounded and reliable approach to swing trading, enhancing the chances of identifying successful trades and managing risk effectively.
Swing Trading Strategies Using Fibonacci Levels
Fibonacci levels are highly effective for identifying potential entry and exit points in swing trading. Here are several strategies that combine Fibonacci retracement and extension levels with various swing trading techniques.
1. Fibonacci Retracement Strategy
Objective: Enter trades at key Fibonacci retracement levels and ride the trend.
How It Works:
- Identify the Trend: First, establish whether the asset is in an uptrend or downtrend. This strategy works best when the trend is clear.
- Plot the Retracement Levels: Once a clear swing high and swing low are identified, use Fibonacci retracement tools to plot the key levels (23.6%, 38.2%, 50%, 61.8%, and 78.6%) on your chart.
- Enter at Key Levels: Enter long positions during an uptrend at retracement levels like 38.2% or 61.8%, where the price is expected to bounce. In a downtrend, short positions can be taken at these retracement levels, where the price is likely to reverse downward.
- Confirmation: Look for other technical indicators like moving averages or RSI to confirm the entry.
Example: In an uptrend, the price retraces to the 61.8% level, showing oversold conditions in the RSI. This setup would signal a potential long trade, with the expectation that the trend will continue upward after the retracement.
2. Fibonacci Extension Strategy
Objective: Use Fibonacci extension levels to set profit targets during a strong trend.
How It Works:
- Plot Fibonacci Extensions: After identifying the swing low and swing high, use Fibonacci extension levels (such as 161.8%, 261.8%, and 423.6%) to project possible profit targets in the direction of the trend.
- Set Profit Targets: During a strong uptrend, traders can set take-profit targets at these extension levels. Conversely, in a downtrend, these levels can be used to project downward targets.
- Multiple Targets: Traders can use the different Fibonacci extension levels as staggered profit-taking points, locking in partial profits as the price reaches each level.
Example: After an uptrend, the price starts retracing and then resumes moving upwards. You identify the 161.8% Fibonacci extension as the first target for profit-taking, followed by the 261.8% level as a secondary target.
3. Fibonacci with Breakout Trading
Objective: Combine Fibonacci retracement levels with breakout strategies to maximize swing trade profits.
How It Works:
- Identify Consolidation: First, identify a consolidation or sideways movement phase where the price is confined within a range.
- Plot Fibonacci Levels: Plot the Fibonacci retracement levels during this consolidation phase, anticipating a breakout in either direction.
- Watch for Breakouts: A breakout above the 0% retracement level (previous swing high) during an uptrend or below the 100% retracement level (previous swing low) in a downtrend signals the continuation of the trend.
- Trade the Breakout: Enter a trade when the breakout occurs with a stop-loss just beyond the 61.8% Fibonacci level to minimize risk. Use Fibonacci extensions (161.8% or 261.8%) for profit targets.
Example: After a period of price consolidation within a Fibonacci retracement range, the stock breaks out above the previous swing high. This breakout signals a continuation of the uptrend, and traders can enter a long position, targeting Fibonacci extension levels.
Benefits of These Strategies
- High-Probability Entries: Entering trades at Fibonacci levels offers high-probability setups due to their frequent alignment with key support and resistance levels.
- Risk Management: Stop-losses can be placed just beyond Fibonacci levels to minimize risk.
- Profit Targeting: Fibonacci extensions provide clear targets, helping traders maximize their gains during trending markets.
Common Mistakes to Avoid When Using Fibonacci Levels
1. Forcing Fibonacci Levels
- Explanation: One common mistake traders make is forcing Fibonacci retracement or extension levels where they don’t naturally align with significant swing highs or lows. This can lead to inaccurate predictions and poor decision-making.
- Why It’s Dangerous: Misaligned Fibonacci levels can give false signals, leading to premature entries or exits, and ultimately, missed opportunities or unnecessary losses.
- Tip: Ensure that Fibonacci levels are plotted based on clear and significant price movements and use other technical indicators to validate their relevance.
2. Relying Solely on Fibonacci Levels
- Explanation: Another common mistake is relying solely on Fibonacci levels without considering other technical indicators or market context.
- Why It’s Dangerous: Fibonacci levels alone cannot provide a complete picture of the market. They need to be combined with other tools like RSI, MACD, or moving averages to improve accuracy.
- Tip: Use Fibonacci levels as a part of a broader technical strategy and always look for confluence with other indicators for stronger validation.
Practical Tips for Using Fibonacci Levels in Swing Trading
1. Wait for Confirmation
- Explanation: While Fibonacci levels can be powerful, entering a trade immediately upon reaching a Fibonacci retracement or extension level can be risky.
- Why It’s Important: Price might react temporarily to a level and then reverse, leading to a false signal. It’s essential to wait for confirmation, such as a candlestick reversal pattern, volume spikes, or confirmation from other indicators.
- Tip: Before entering a trade at a Fibonacci level, wait for price action confirmation or alignment with other technical signals.
2. Use Multiple Time Frames
- Explanation: Fibonacci levels plotted on different time frames can offer a more comprehensive view of potential support and resistance areas.
- Why It’s Important: A Fibonacci level on a higher time frame, like a daily or weekly chart, can carry more weight than one on a 15-minute or hourly chart.
- Tip: Cross-reference Fibonacci levels across multiple time frames to validate trade setups and improve accuracy.
3. Patience is Key
- Explanation: Swing trading with Fibonacci levels often requires patience. Price can fluctuate before reaching the targeted Fibonacci retracement or extension levels.
- Why It’s Important: Traders may get impatient and exit trades prematurely, missing out on potential profits. Price may hover around a Fibonacci level for a while before making a significant move.
- Tip: Practice patience when trading Fibonacci levels. Wait for the price to reach key levels and show confirmation before acting, and avoid the temptation to close trades too early.
Conclusion
Fibonacci levels are a powerful tool in swing trading, offering traders a reliable way to identify potential areas of support, resistance, and trend reversals. By understanding how to correctly plot and interpret these levels, swing traders can enhance their timing for entries and exits, leading to more informed and profitable decisions.
However, Fibonacci levels should not be used in isolation. The key to success lies in combining them with other technical indicators such as moving averages, RSI, or trendlines to strengthen the validity of your trades. Avoid common pitfalls, such as forcing Fibonacci levels where they don’t belong and being overly reliant on them without confirmation from other tools.
Patience and discipline are vital when trading with Fibonacci levels. By practicing these principles and refining your strategy, you can effectively integrate Fibonacci retracements and extensions into your swing trading approach for improved results.
Remember, consistency and adaptability will ensure you harness the full potential of Fibonacci levels in your trading journey.

