In the fast-paced world of swing trading, spotting the right opportunities can be the difference between a profitable trade and a missed chance.
But how do you know if a price movement is strong enough to act on?
Thats were role of Volume in swing trading comes in play.
While many traders focus solely on price action, volume is the silent force that reveals the strength behind market moves.
Whether you’re looking to confirm trends, detect reversals, or assess the momentum of a stock, volume can be your ultimate guide.
In this blog, we’ll dive into how understanding volume can elevate your swing trading game and help you make more informed, profitable decisions.
What is Volume in Trading?
Volume in trading refers to the total number of shares, contracts, or units of a security traded during a specific time frame, such as a day, hour, or even a minute.
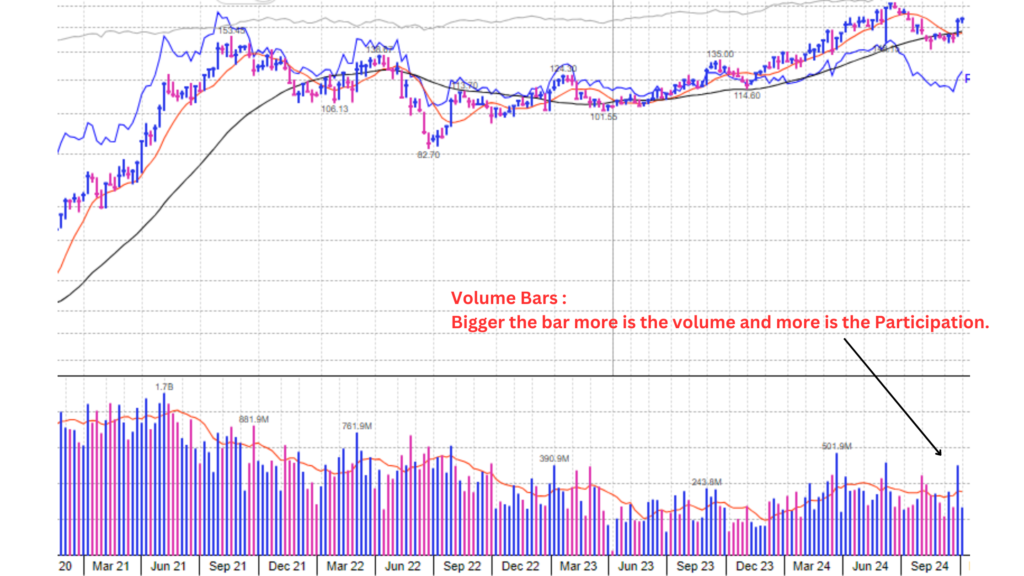
It is one of the most fundamental indicators used in technical analysis because it provides insights into the level of participation and activity in a market.
Volume reflects the level of interest or enthusiasm that traders and investors have in a particular stock, commodity, or other financial asset.
When trading volume is high, it typically indicates that there is strong participation from both buyers and sellers, often signaling that a significant price movement is underway.
This high level of activity can occur during events such as news releases, earnings reports, or technical breakouts.
On the other hand, low volume suggests that fewer market participants are active, which can indicate indecision or a lack of confidence in the current market direction.
Volume is also used to confirm trends, reversals, and breakout patterns.
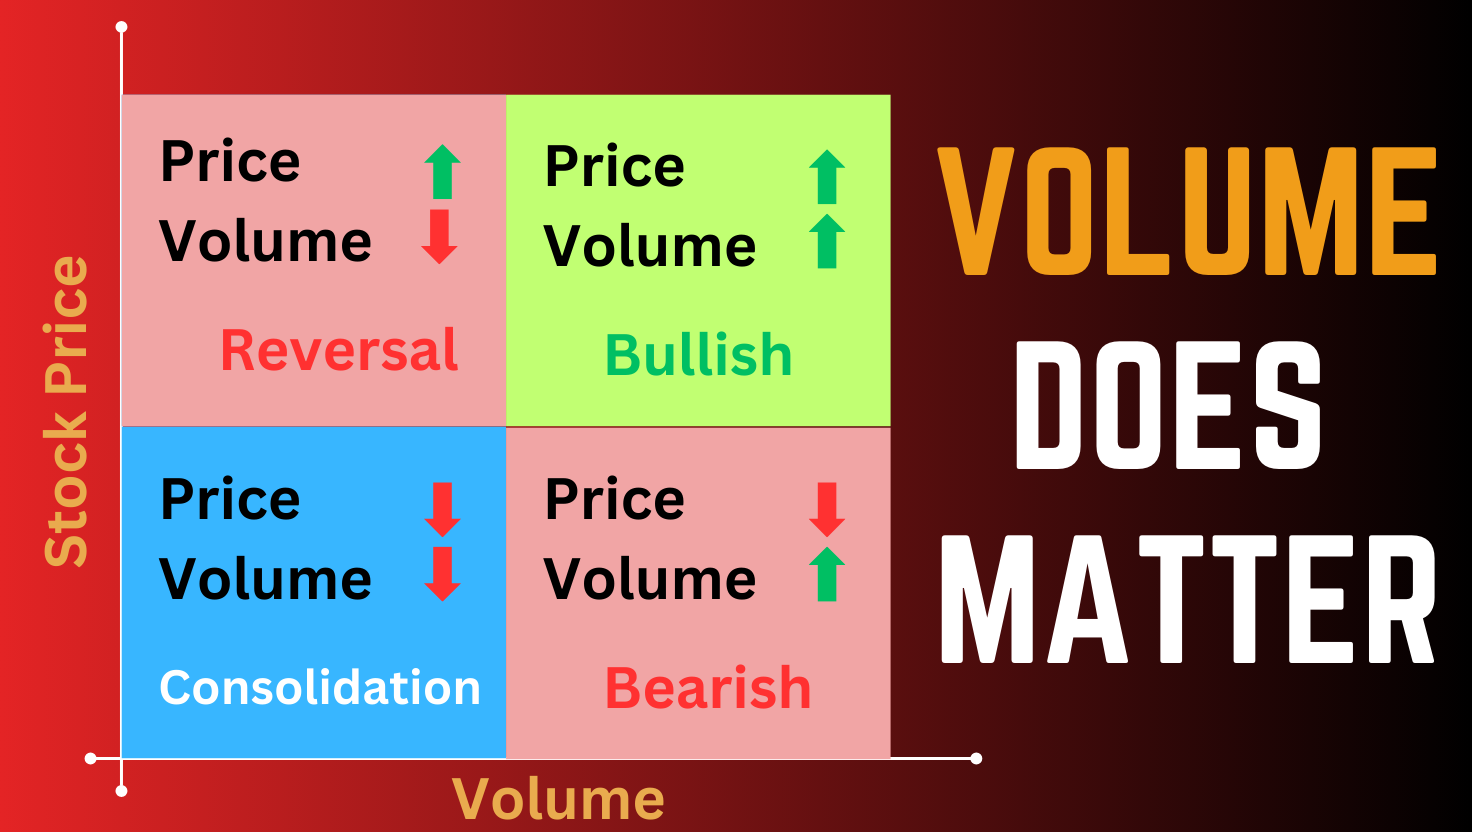
For instance, a price increase accompanied by high volume is generally seen as a stronger, more reliable move than one that occurs on low volume. In contrast, a price movement that happens with low volume may signal a lack of conviction behind the trend, potentially setting the stage for a reversal.
Volume is recorded and displayed in histograms beneath the price chart, allowing traders to quickly assess the strength or weakness of a price move.
In essence, volume helps to answer the question: “Is the market behind this price movement?”
By understanding the role of volume in trading, swing traders can make more informed decisions about when to enter or exit a position, and better manage risk in volatile markets.
Why is Volume Important in Swing Trading?
Volume plays a crucial role in swing trading because it helps confirm the validity of price movements and trends.
For swing traders, who aim to capture short- to medium-term price swings, understanding volume is essential to ensure that the price action they’re seeing is backed by genuine market participation and not just a temporary fluctuation.
#1 Confirmation of Price Movements and Trends
When a stock or asset is trending in a particular direction, volume acts as a confirmation tool.
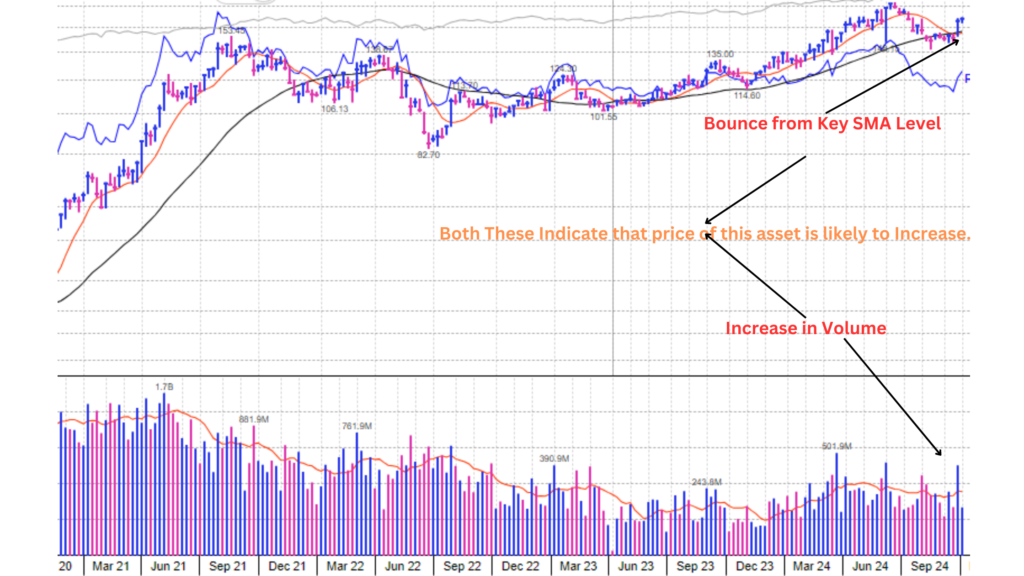
A strong upward or downward price movement accompanied by high volume suggests that the market supports the move and that it is likely to continue.
For example, if a stock breaks out of a key resistance level on high volume, it indicates strong buying interest, making the breakout more reliable. Conversely, a breakout with low volume may signal a lack of conviction from market participants, increasing the chances of a false breakout.
#2 Volume and Momentum
There is a direct relationship between volume and momentum.
Typically, strong price movements are accompanied by increased trading volume, as more traders and investors participate in the move.
Higher volume during a trend indicates momentum is building, while declining volume may signal that the trend is losing steam. Swing traders often use volume as a momentum indicator to time their entries and exits more effectively.
#3 Insight into Reversals, Breakouts, and Continuations
Volume can provide critical insights into potential market reversals, breakouts, and trend continuations. For example:
- Reversals: A price reversal is often preceded by a spike in volume, as a large number of traders begin to close out existing positions or establish new ones. If volume increases significantly during a reversal, it suggests the market sentiment has shifted, providing a stronger signal for traders to adjust their positions.
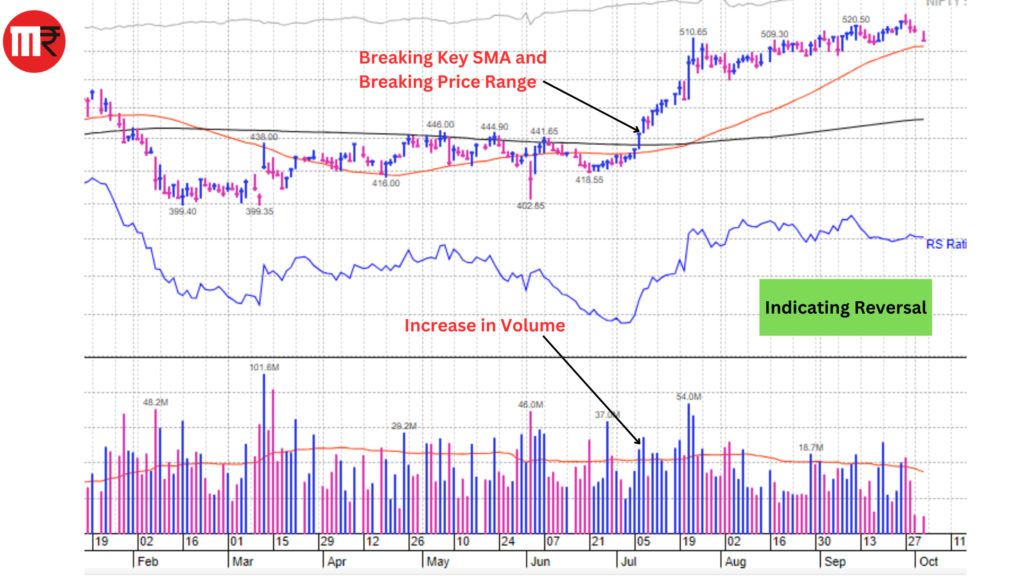
- Breakouts: When price breaks through a key level of support or resistance, swing traders look to volume to confirm the breakout. A breakout with strong volume is more likely to result in a sustained move, while a low-volume breakout may lack the momentum to continue.
- Continuations: During periods of consolidation, volume tends to decrease. However, when the price moves out of consolidation, an increase in volume can confirm that the existing trend will continue. For swing traders, spotting these patterns can help identify profitable continuation trades.
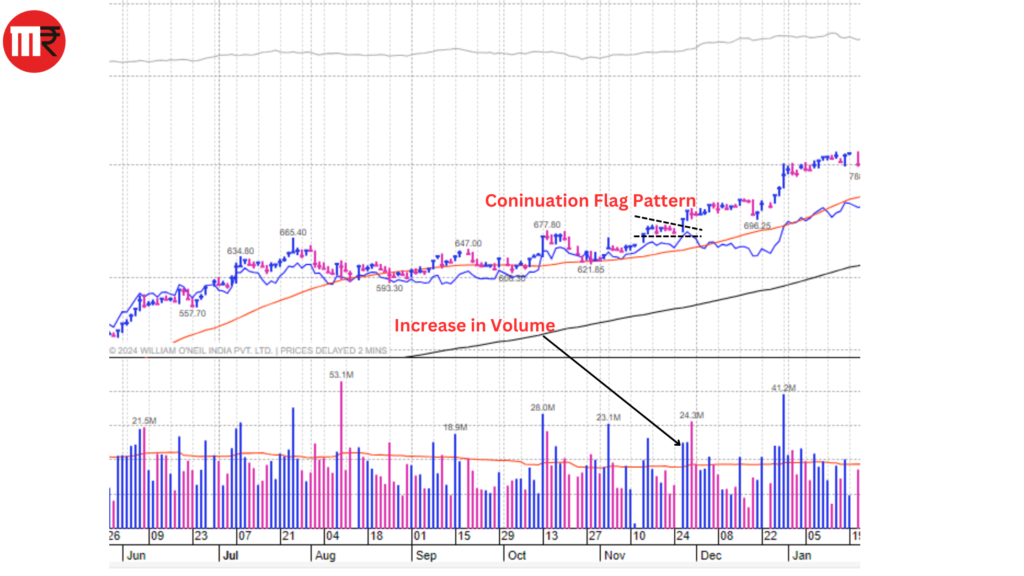
In summary, volume provides swing traders with valuable insights into the strength and sustainability of price movements.
By analyzing volume alongside price action and Chart Patterns, traders can make more informed decisions, avoid false signals, and increase the likelihood of success in their trades.
Key Volume Indicators for Swing Trading
Volume indicators help traders analyze the relationship between volume and price to better understand market sentiment and trend strength. Here are some of the most effective volume indicators used in swing trading.
On-Balance Volume (OBV)
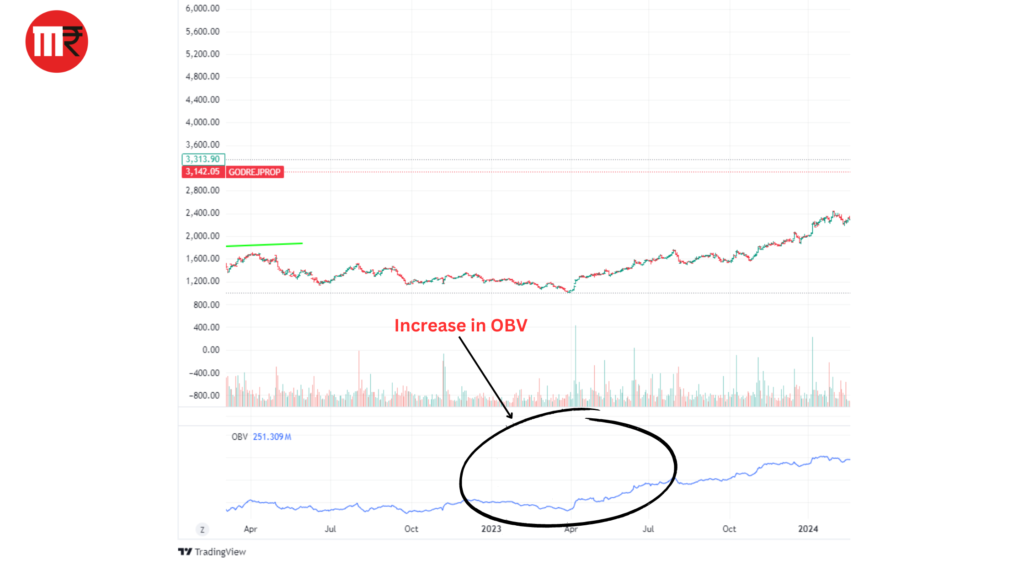
OBV tracks the cumulative volume flow by adding volume on days when the price closes higher and subtracting volume on days when the price closes lower. This helps measure the overall buying and selling pressure in the market.
How it Works
- Rising OBV: Indicates strong buying pressure and often precedes price increases.
- Falling OBV: Reflects selling pressure, often signaling that a price decline is likely.
- Why Swing Traders Use OBV:
OBV is valuable for confirming trends and detecting divergences. For instance, if the price is rising but OBV is falling, it might indicate a weakening trend, signaling a potential reversal.
Volume Moving Average
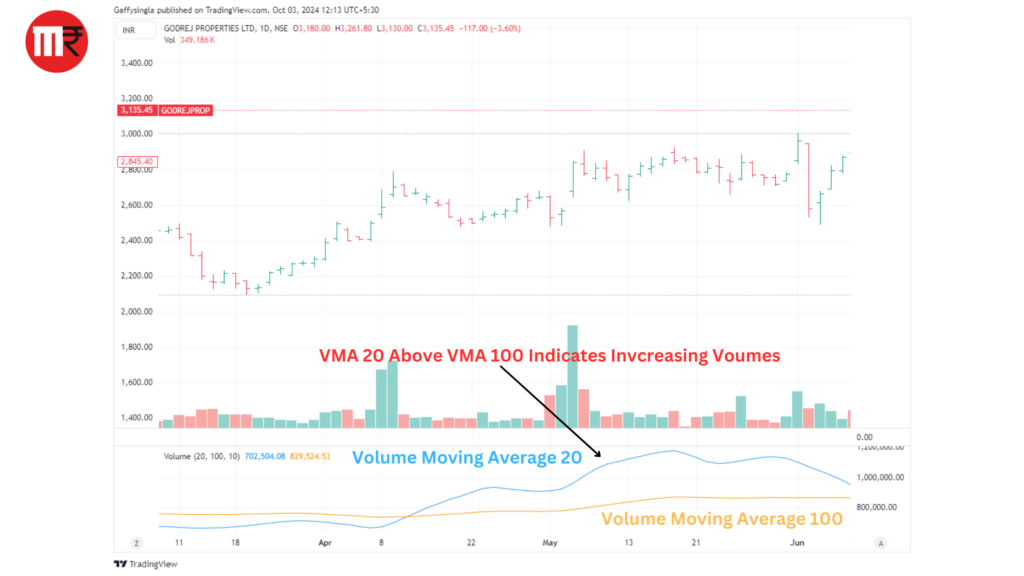
A volume moving average smooths out volume data over a set period, such as 20 or 50 days, to help spot trends in volume.
How it Works
- Swing traders look for spikes above or below the average volume, indicating potential shifts in market sentiment or momentum.
- Above Average Volume: Signals increased interest in the stock and a possible trend continuation.
- Below Average Volume: Suggests less market participation, which may indicate a weakening trend or consolidation.
- Why Swing Traders Use It:
Volume moving averages help traders identify breakouts or breakdowns and assess whether the volume behind a price move is sufficient to sustain a trend.
Volume Oscillator
The Volume Oscillator measures the difference between two volume moving averages (one shorter, one longer). It helps swing traders gauge shifts in momentum by identifying volume spikes relative to historical averages.
How it Works
- When the short-term moving average crosses above the long-term moving average, it signals increasing momentum, potentially supporting a price breakout.
- When the short-term moving average falls below the long-term moving average, it indicates weakening momentum, suggesting the trend might lose strength.
- Why Swing Traders Use It:
The Volume Oscillator is effective for spotting early signs of trend reversals and changes in momentum, helping traders time their entries and exits more accurately.
Accumulation/Distribution Line (A/D Line)
The A/D Line combines both price and volume to determine whether a stock is being accumulated (bought) or distributed (sold) by traders. It provides a clear indication of the strength behind a price movement.
How it Works
- Rising A/D Line: Indicates that accumulation is taking place, suggesting that buyers are supporting the price.
- Falling A/D Line: Suggests that distribution is happening, meaning sellers are dominating the market.
- Why Swing Traders Use It:
The A/D Line helps confirm trends by showing whether price movements are supported by strong buying or selling pressure. It’s especially useful in determining the sustainability of a trend, as rising prices without corresponding increases in the A/D Line may indicate a weak rally.
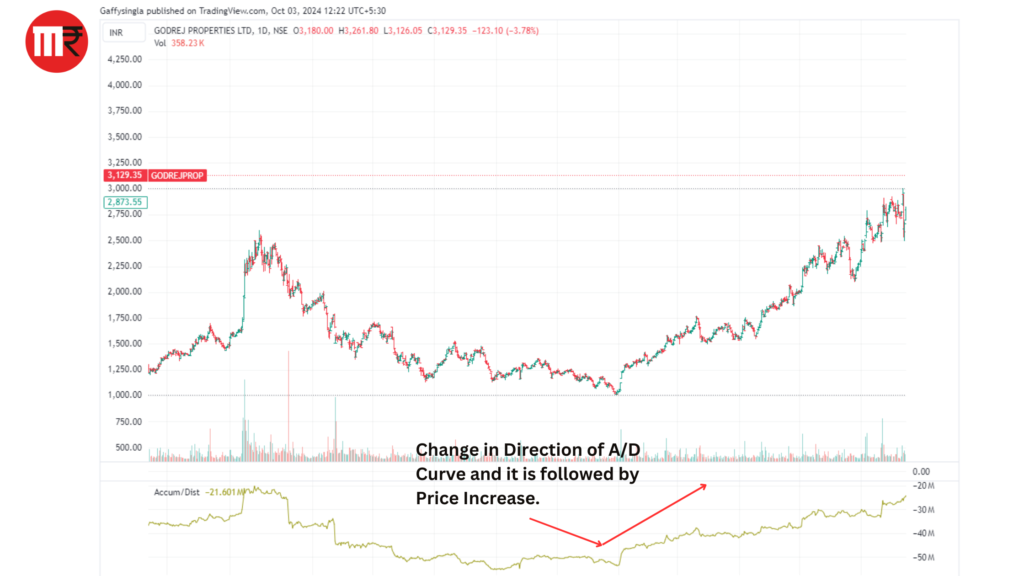
By using these volume indicators in combination with chart patterns and price action, swing traders can better understand the market’s sentiment, improve their trade timing, and make more informed trading decisions.
You can access all these indicators on Tradingview.com
How to Use Volume in Swing Trading
Here’s how swing traders can effectively utilize volume to improve their trading decisions:
#1 For Confirmation of Trend Strength
Volume is a key indicator of the strength behind a price movement. When a trend is supported by increasing volume, it suggests that the trend is likely to continue as more traders are participating in the market.
- Uptrend with Increasing Volume: This indicates strong buying interest and validates the upward trend.
- Downtrend with Increasing Volume: Suggests strong selling pressure, confirming that the downward trend is likely to persist. Example:
In a bullish trend, if volume continues to rise as the price increases, it signals that the uptrend is supported by strong market participation, reducing the chances of a false move.
#2 Identifying Breakouts
A breakout occurs when the price moves above a resistance level or below a support level. Volume is essential in confirming whether a breakout is genuine or likely to fail.
- High Volume Breakout: A breakout accompanied by a significant increase in volume indicates strong conviction behind the move and suggests that the price will likely continue in the direction of the breakout.
- Low Volume Breakout: If a breakout occurs with low volume, it may indicate a lack of market participation, increasing the likelihood of a false breakout and a potential price reversal.
In a rising wedge pattern, a breakout above resistance with increasing volume would confirm the breakout’s validity and signal a potential buying opportunity.
#3 Spotting Reversals
Trends often weaken before reversing, and volume can help traders spot these potential reversals early. When a price movement loses strength, volume tends to decline, signaling that the current trend may be running out of momentum.
- Declining Volume in an Uptrend: Indicates weakening buying interest, suggesting a potential reversal to the downside.
- Declining Volume in a Downtrend: Reflects diminishing selling pressure, signaling that a bullish reversal might be imminent.
If a stock has been in an uptrend but volume starts to decline while the price continues to rise, this divergence between price and volume might signal that the uptrend is losing steam and a reversal could be near.
#4 Volume Spikes
Sudden spikes in volume can indicate major shifts in market sentiment, often marking the beginning of new trends or significant market moves. Volume spikes typically occur after a major news event, earnings report, or other market catalysts.
- Volume Spike During Breakout: Confirms the strength of the breakout and signals the start of a new trend.
- Volume Spike During a Consolidation Period: A spike in volume can signal that a breakout from consolidation is likely to occur soon.
In a sideways market, a sudden surge in volume coupled with a price breakout from a consolidation zone can indicate that the market is transitioning into a trending phase, providing an ideal entry opportunity for swing traders.
By understanding how to interpret volume data, swing traders can enhance their ability to confirm trends, identify breakouts, and anticipate reversals, leading to more informed and profitable trading decisions.
Volume and Price Relationship in Swing Trading
Understanding the relationship between volume and price is essential for swing traders to assess the strength or weakness of a price movement. Here’s how different volume and price scenarios impact trading decisions:
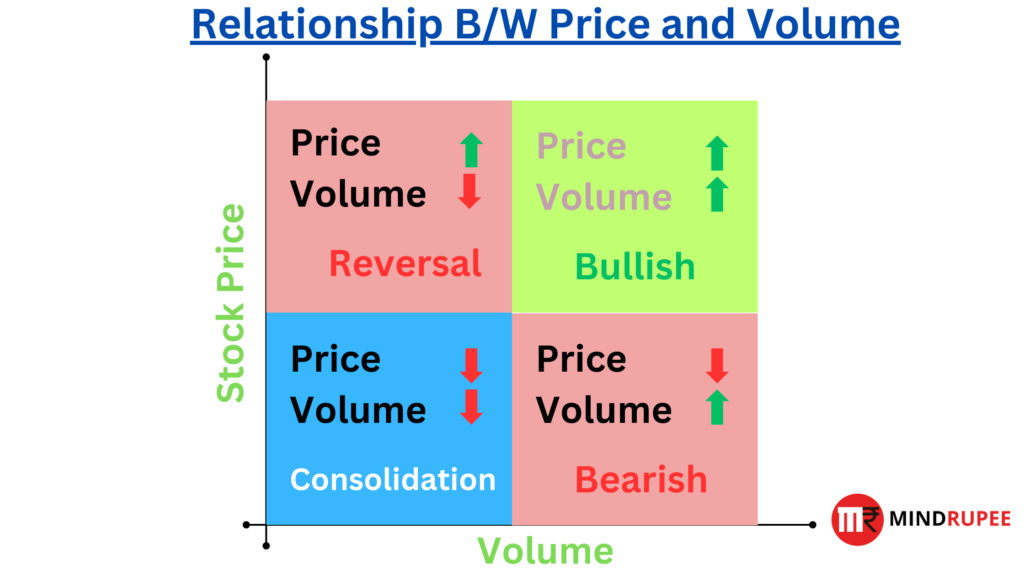
1. Price Increases with High Volume
When the price of a stock rises with high volume, it signals strong market interest and participation. This indicates that buyers are confident, and the upward trend is likely to continue.
- Bullish Sign: A rising price with increasing volume is a confirmation of the strength of the uptrend.
- Example: If a stock breaks above a key resistance level with a significant increase in volume, it suggests a strong buying conviction, indicating that the breakout is likely to sustain.
2. Price Increases with Low Volume
A price increase with low volume is typically a warning sign. It indicates that fewer participants are driving the price higher, which could signal a lack of interest or weak support for the uptrend.
- Potential Reversal: If the price continues to rise on decreasing volume, it might indicate a weakening trend, increasing the likelihood of a reversal or pullback.
- Example: If a stock moves up toward resistance with declining volume, it might suggest the rally is unsustainable, and the price could reverse once it hits that resistance level.
3. Price Declines with High Volume
When a price decline is accompanied by high volume, it signals strong selling pressure. This suggests that traders are exiting their positions en masse, and the downtrend is likely to continue.
- Bearish Sign: A sharp price decline with increasing volume is a strong signal that the selling momentum is robust, and the downward trend may persist.
- Example: If a stock breaks below a key support level with a surge in volume, it indicates that the sell-off is strong, and the price could continue falling.
4. Price Declines with Low Volume
A price decline on low volume may indicate that the downtrend is weakening. With fewer sellers driving the price down, it suggests a lack of strong selling interest, potentially signaling a bottom or an upcoming reversal.
- Potential Reversal or Consolidation: If the price drops with decreasing volume, it could indicate that the selling pressure is fading, and the price might stabilize or reverse.
- Example: In a downtrend, if the price continues to fall but volume decreases, this divergence may suggest the trend is losing momentum, and traders should watch for signs of a reversal.
By analyzing the relationship between volume and price movements, swing traders can make more informed decisions about the strength of trends and identify potential turning points in the market.
Common Mistakes to Avoid When Using Volume in Swing Trading
1. Ignoring Volume Divergence
Volume divergence occurs when price and volume move in opposite directions, signaling a potential weakening or reversal of the current trend. For example, if the price is rising but volume is decreasing, it may indicate that the trend lacks strong support and could soon reverse. Ignoring these signals can lead to missed opportunities or poor trading decisions.
How to Avoid It
- Always pay attention to the relationship between price and volume.
- When price trends higher but volume trends lower, consider it a warning sign of potential trend exhaustion.
2. Relying Solely on Volume
While volume is a crucial indicator, relying on it exclusively can result in incomplete analysis. Volume should be used in conjunction with other technical indicators such as moving averages, RSI, or MACD to confirm trend strength and validate trading signals.
How to Avoid It
- Use volume as part of a broader analysis that includes chart patterns and other technical indicators.
- Validate volume signals with price action and trend indicators before making trading decisions.
3. Overreacting to Single Volume Spikes
A sudden spike in volume can sometimes indicate increased market interest or news-driven moves. However, overreacting to a single spike without considering the context can lead to impulsive trading decisions. Some spikes may not reflect sustained momentum and can result in false breakouts or breakdowns.
How to Avoid It
- Analyze the context around volume spikes by looking at the overall trend and any supporting technical indicators.
- Wait for confirmation from price action or other signals before reacting to a volume spike.
By avoiding these common mistakes, swing traders can better use volume analysis to make informed and disciplined trading decisions, leading to greater success in the markets.
Conclusion
Volume is a crucial element in swing trading because it helps confirm the strength of price movements, trends, and potential breakouts. When combined with price action, volume can validate whether a trend is likely to continue or reverse, offering traders a clearer picture of market sentiment.
Volume spikes often signal heightened activity, giving traders confidence in their decision-making. It is essential to include volume analysis as part of a broader technical strategy to make informed trading choices.
To maximize the effectiveness of swing trading, it is critical to use volume analysis in combination with other technical indicators like RSI, MACD, or moving averages. These tools together offer a more comprehensive view of the market, helping traders fine-tune their entries, exits, and overall trading strategies.
By integrating volume into their analysis, traders can improve the accuracy of their trades and reduce the likelihood of false signals.
While volume is an indispensable tool for swing traders, it should not be used in isolation.
Its real power lies in conjunction with other technical indicators that together can provide a holistic view of market conditions.
Traders are encouraged to practice and back-test strategies, experimenting with different combinations of volume and other indicators, to refine their swing trading approach and boost profitability over time.

