In the world of swing trading, identifying key price levels is akin to knowing the road map of a journey.
Two of the most critical concepts that guide traders on this path are Support and Resistance. Whether you’re looking for an entry point or determining when to exit a position, these levels provide crucial insight into market behavior.
Support and resistance levels essentially represent the boundaries of price movement.
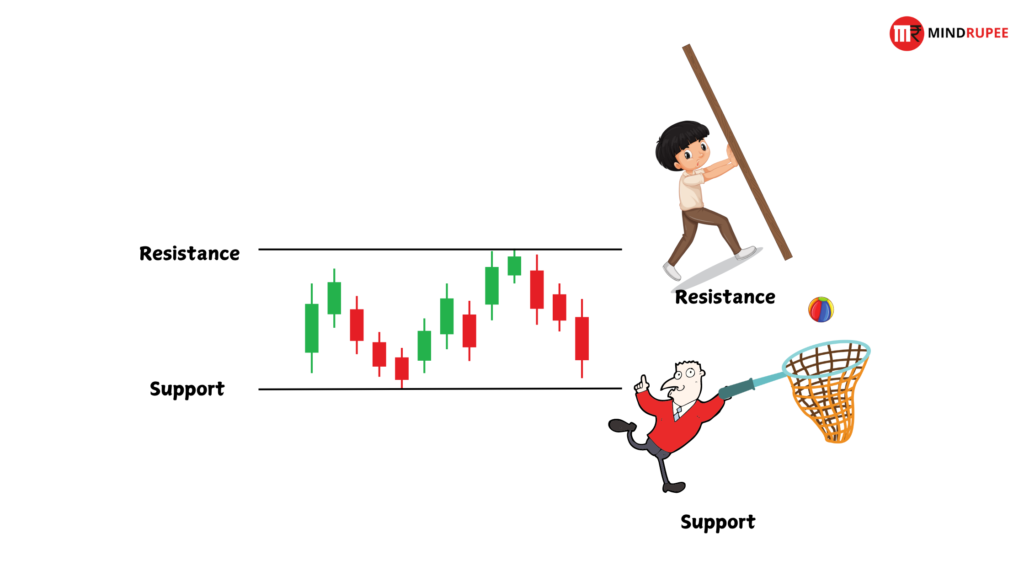
Support acts like a floor, a price level where buyers are expected to step in, preventing the price from falling further. Resistance, on the other hand, is the ceiling that caps upward price movement, where sellers are likely to take control.
Swing trading , by its nature, revolves around price fluctuations between these key levels.
Traders capitalize on these short- to medium-term moves, seeking to buy at or near support levels and sell at or near resistance. Understanding and effectively identifying these levels offers traders the opportunity to make more informed decisions, avoid potential traps, and maximize their gains.
Mastering the ability to spot support and resistance can give traders a significant edge in the market. It provides a framework to predict potential reversals or breakouts, helping traders stay one step ahead of price action.
As we explore further, you’ll learn how to accurately identify these levels, the different types that exist, and the best strategies to trade them.
In essence, support and resistance are the backbone of swing trading, offering guidance through the noise of daily price fluctuations and forming the foundation for a successful trading strategy.
What is Support and Resistance?
In technical analysis, support and resistance are fundamental concepts that help traders anticipate where prices might pause, reverse, or continue their movement.
These levels act as invisible barriers, shaping the behavior of market participants by defining zones of buying and selling interest.
While support signals a floor for prices, resistance marks a ceiling, and together, they create a framework for identifying potential trade opportunities.
Defining Support: The Safety Net
Support is the price level where demand becomes strong enough to prevent the price from falling further. In simple terms, it’s the point at which the market believes a security is undervalued, leading buyers to step in and create upward pressure.
Imagine it as a safety net that stops prices from dropping freely—whenever the market reaches this level, it “bounces” upward due to increased demand.
The psychology behind support lies in market sentiment.
At support levels, traders and investors perceive value, believing the price has hit a point where it’s worth buying.
This influx of buying interest halts the downward momentum.
For example, if a stock has historically bounced from Rs. 50, traders may anticipate it to do so again, triggering a wave of buying orders around that price. The more often a support level holds, the more confident traders become in its reliability.
However, once this level is broken, it can signal that sentiment has shifted and that sellers are overpowering buyers, often leading to further declines.
Defining Resistance: The Ceiling of Price
Resistance, conversely, is the price level where selling pressure is strong enough to prevent prices from rising higher. It acts as a ceiling, capping price movement as traders believe the asset is overvalued, prompting them to sell. This selling activity either halts or reverses the upward momentum.
The psychology behind resistance is the opposite of support.
At resistance levels, traders see the price as too high or overbought, leading them to sell and lock in profits. As more sellers enter the market, the increased supply of shares or assets outweighs demand, causing prices to stall or reverse.
For example, if a stock consistently struggles to rise above Rs.100, traders may view this as a signal to sell, leading to a price retreat from that level.
Just like with support, when resistance is broken, it can signal a shift in market sentiment—buyers have overpowered sellers, and prices may continue to rise.
This is often the precursor to a breakout, where resistance flips to become the new support.
Types of Support and Resistance Levels: Static vs. Dynamic
In swing trading, understanding the different types of support and resistance is crucial for making informed decisions.
These levels come in two broad categories:
- Static
- Dynamic
Static support and resistance levels remain constant regardless of time, while dynamic levels shift with the price action and adapt to changing market conditions.
Static Support and Resistances
Horizontal Levels: The Classic Approach
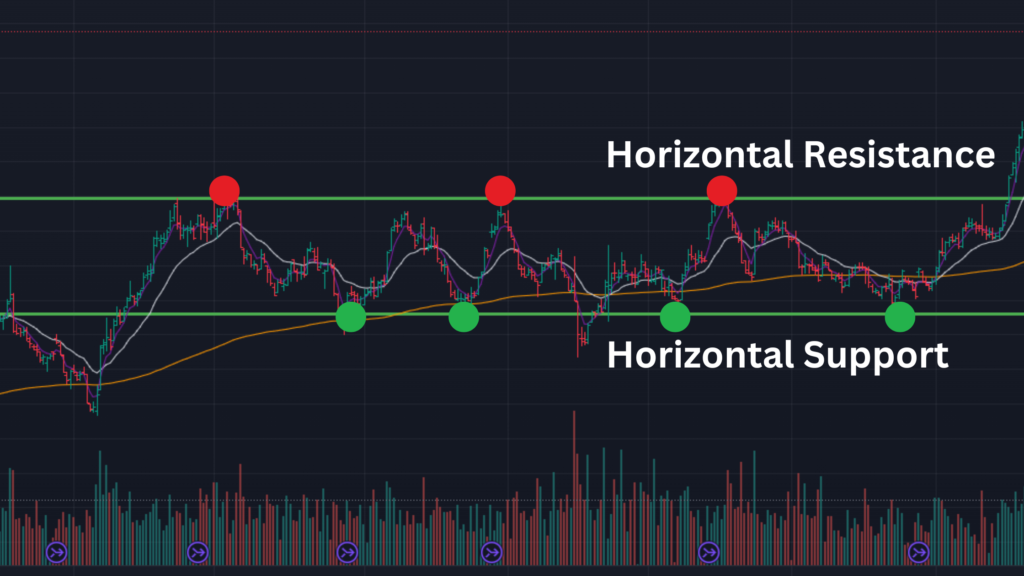
Horizontal support and resistance levels are the most basic and commonly used form of static support and resistance.
These levels form when prices historically reverse or consolidate at specific price points, creating zones of interest. Traders use these levels to mark areas where price changes direction multiple times, establishing the reliability of the level.
These key levels act as magnets for price because market participants expect a reaction at these points, whether a bounce, rejection, or breakout.
The more frequently the price touches a horizontal level without breaking through, the stronger that level becomes. However, when a level is breached, the market often reacts dramatically, signaling a potential shift in trend direction.
Psychological Levels: The Influence of Round Numbers
Psychological levels refer to price points that are rounded numbers, such as Rs.50, Rs.100, Rs.1,000, or similar values.
These levels hold significance because human psychology tends to gravitate towards round numbers when making trading decisions.
For instance, a stock nearing Rs.100 is more likely to face strong resistance or support than at Rs. 97.50.
These round numbers create actionable patterns because traders often place buy or sell orders around them, making these levels self-fulfilling prophecies.
Many retail and institutional traders alike believe that price tends to react strongly near psychological levels, which can trigger more buying or selling pressure. As a result, price often stalls or reverses near these zones.
Additionally, round numbers tend to serve as key milestones in the market—when they are breached, they can lead to significant price movements.
Dynamic Support and Resistances
Trendlines: The Power of Dynamic Support and Resistance
Trendlines represent dynamic support and resistance levels, as they evolve with price movements over time.
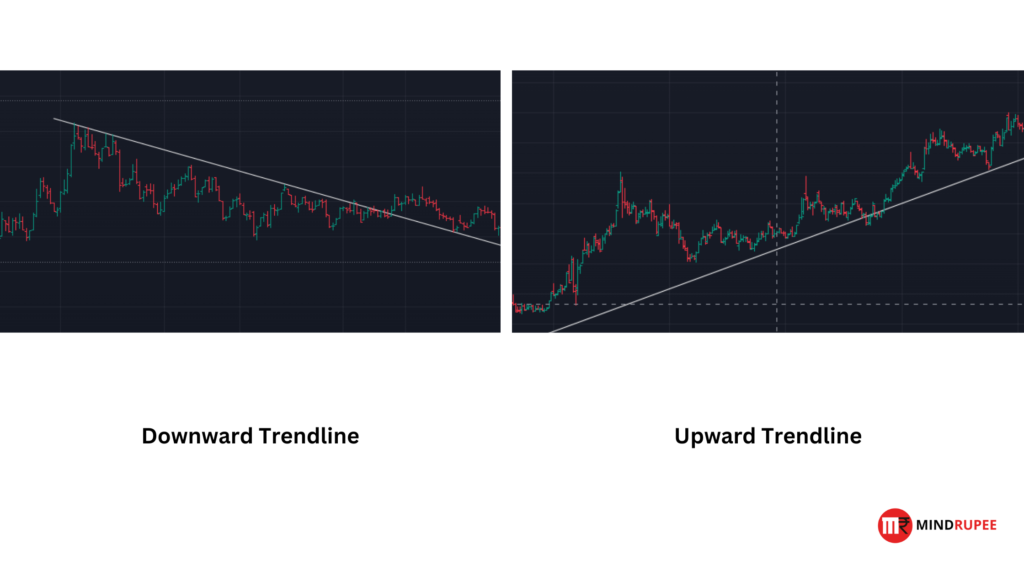
A trendline is drawn by connecting a series of higher lows in an uptrend (support) or lower highs in a downtrend (resistance).
Unlike horizontal levels, trendlines provide visual cues for traders to follow the general direction of a trend while identifying where price might bounce or reverse.
Upward trendlines provide dynamic support, as they indicate rising demand, while downward trendlines serve as dynamic resistance, showing increasing selling pressure.
Trendlines are particularly useful in trending markets because they help traders identify where price corrections might halt and the trend resumes.
To effectively draw and validate trendlines:
- Use multiple touchpoints: A minimum of two points is required to draw a trendline, but three or more solidifies its strength.
- Adjust for volatility: Trendlines should be flexible enough to account for price wicks (sharp but temporary moves) but should still capture the overall direction of price.
- Watch for breaks: If price breaks a trendline, it could indicate a reversal or weakening of the current trend.
Moving Averages as Floating Support and Resistance
Moving averages (MAs) are another form of dynamic support and resistance. These technical indicators smooth out price data by calculating the average price over a specific period (e.g., 50-day or 200-day), which shifts as new price data is added. Because moving averages adjust to price changes, they are often referred to as “floating” levels of support or resistance.
The 50-day moving average (50 MA) and 200-day moving average (200 MA) are among the most widely followed by traders. These moving averages provide:
- Support during uptrends: When prices pull back, moving averages often serve as temporary support, giving traders a cue to buy into the trend.
- Resistance during downtrends: When prices attempt to rise but face resistance at the moving average, traders interpret it as a sign that sellers are in control.

Moving averages are especially useful for identifying long-term market trends. Traders use them to gauge the overall direction of the market and identify potential entry or exit points.
For instance, when a shorter-term moving average (e.g., 50 MA) crosses above a longer-term moving average (e.g., 200 MA), it signals a golden cross, suggesting bullish momentum. The reverse, known as a death cross, indicates bearish momentum.
Balancing Static and Dynamic Levels
In swing trading, using a combination of static horizontal levels and dynamic tools like trendlines and moving averages enables traders to better predict price behavior.
Horizontal levels provide clear-cut zones of interest, while trendlines and moving averages offer guidance in trending markets, adapting to price shifts.
Whether relying on classic support/resistance zones or advanced dynamic indicators, recognizing the type of level in play is essential for making strategic trading decisions.
Techniques to Identify Key Levels in Swing Trading
Identifying key levels in swing trading is crucial for making accurate predictions about price movements. Traders use various techniques to spot potential support and resistance zones, helping them make informed entry and exit decisions. Below are some of the most common methods used to identify these levels.
Historical Price Action: Learning from the Past
One of the simplest yet most powerful ways to identify support and resistance is by analyzing historical price action.
Past price movements often leave clues about where key levels exist. By looking at a price chart, traders can observe recurring patterns, including areas where the price has consistently reversed or consolidated.
These historical levels, whether from a few days, weeks, or even months ago, tend to act as future reference points. For example, if a stock has bounced multiple times from a specific price in the past, that level is considered strong support. Likewise, if it has repeatedly struggled to move past a certain price, that price becomes a resistance zone.
How to mark recurring levels of reversal:
- Look for areas where the price has reversed direction several times (either upward or downward).
- Draw horizontal lines or zones at these levels to signify potential support or resistance.
- Keep in mind that these levels are rarely exact; instead, think of them as “zones” where price may react, rather than a single point.
Volume and Confirmation: The Role of Market Participation
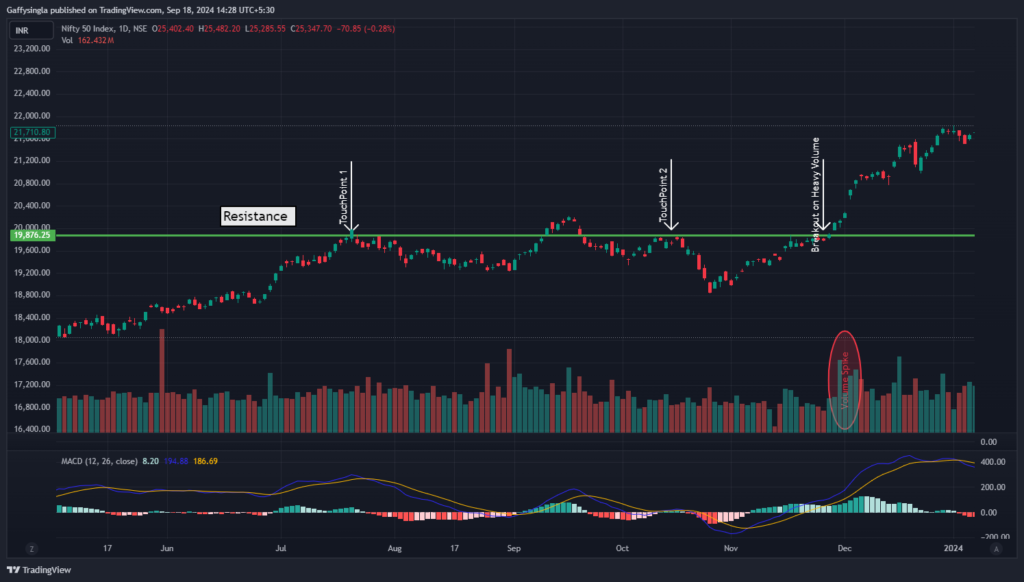
Volume is another key tool for identifying and confirming support and resistance levels.
Volume spikes occur when there is a large increase in trading activity, indicating strong market participation. These spikes often coincide with key levels, suggesting that a large number of traders are reacting to price movement.
For example, if price approaches a known support level and volume increases significantly, it indicates that buyers are stepping in with confidence, making it more likely for the price to bounce off that support.
Conversely, if price approaches resistance with increased volume, it might signal that sellers are ready to take control and push the price down.
Key takeaways on volume:
- High volume near support/resistance: Confirms the strength of the level and suggests that the price is likely to reverse.
- Low volume: Indicates that the level may not be as significant, increasing the chances of a breakout or breakdown.
- Volume can also signal the intensity of a breakout—if price breaks through support or resistance on high volume, it is more likely to sustain the new trend.
Fibonacci Retracements: A Mathematical Approach
Fibonacci retracements are a popular tool for predicting where future support and resistance levels may form.
Based on the Fibonacci sequence, this method uses key ratios—38.2%, 50%, and 61.8%—to indicate potential reversal points in the market. Traders use these levels to identify where pullbacks or corrections are likely to end and the trend might resume.
To use Fibonacci retracements:
- Draw the Fibonacci retracement tool from a recent high to a recent low (for an uptrend) or from a recent low to a recent high (for a downtrend).
- The key Fibonacci levels (38.2%, 50%, 61.8%) will automatically be plotted on the chart, showing where price might encounter support or resistance during its correction.

Significance of Fibonacci levels:
- 38.2% retracement: Often acts as a minor level of support/resistance during a shallow correction.
- 50% retracement: A psychologically important level where traders often expect a reversal.
- 61.8% retracement: Known as the “golden ratio,” this is considered one of the most reliable levels for reversals, as it’s tied to natural patterns in markets.
Pivot Points: Calculating Key Levels
Pivot points are another widely-used method to identify support and resistance levels. They are calculated based on the previous day’s high, low, and closing prices and are used to predict future levels where the price might reverse.
Pivot points provide traders with multiple levels of support (S1, S2, S3) and resistance (R1, R2, R3) around a central pivot point (P).

The basic formula for calculating the pivot point (P) is:

Benefits of pivot points:
- They are objective and easy to calculate, providing traders with a clear framework for identifying key levels.
- Pivot points are particularly useful for short-term traders and are often used by day traders and swing traders alike to gauge potential support and resistance for the current trading day.
By combining these techniques—historical price action, volume confirmation, Fibonacci retracements, and pivot points—swing traders can more effectively identify key support and resistance levels.
Each method offers a unique perspective, and when used together, they provide a comprehensive view of where price might reverse or break out, giving traders a clear advantage in navigating market movements.
Strategies to Trade Support and Resistance Levels
Once you’ve identified key support and resistance levels, the next step is to use strategies that capitalize on these zones to maximize profit potential.
Below are some of the most effective strategies to trade support and resistance, including how to handle breakouts, reversals, and role reversals between support and resistance.
Breakouts: When the Market Defies Expectations
A breakout occurs when the price moves beyond a previously established support or resistance level. It signals a shift in market sentiment and is often accompanied by increased volatility as new traders jump in, expecting a strong price movement in the breakout direction.
Breakouts can happen in both bullish and bearish markets:
- Bullish breakout: When the price breaks above a resistance level.
- Bearish breakout: When the price falls below a support level.
Volume Confirmation in Breakouts One of the most important factors to confirm a breakout is volume.
A true breakout is often accompanied by higher-than-average volume, indicating that a large number of traders are participating and validating the price movement.
If the breakout happens on low volume, it may not have the momentum to sustain the new trend, and the price could revert back to the previous range.
How to Capitalize on Strong Breakouts
- Entry points: Enter the trade when the price closes above resistance (in the case of a bullish breakout) or below support (for a bearish breakout), ideally with a surge in volume.
- Stop-loss placement: Set a stop-loss just below the breakout level (for a bullish breakout) or just above it (for a bearish breakout) to manage risk in case of a failed breakout.
- Take profit: Use a measured move target, calculated as the height of the previous price range, to estimate where the price might go post-breakout.
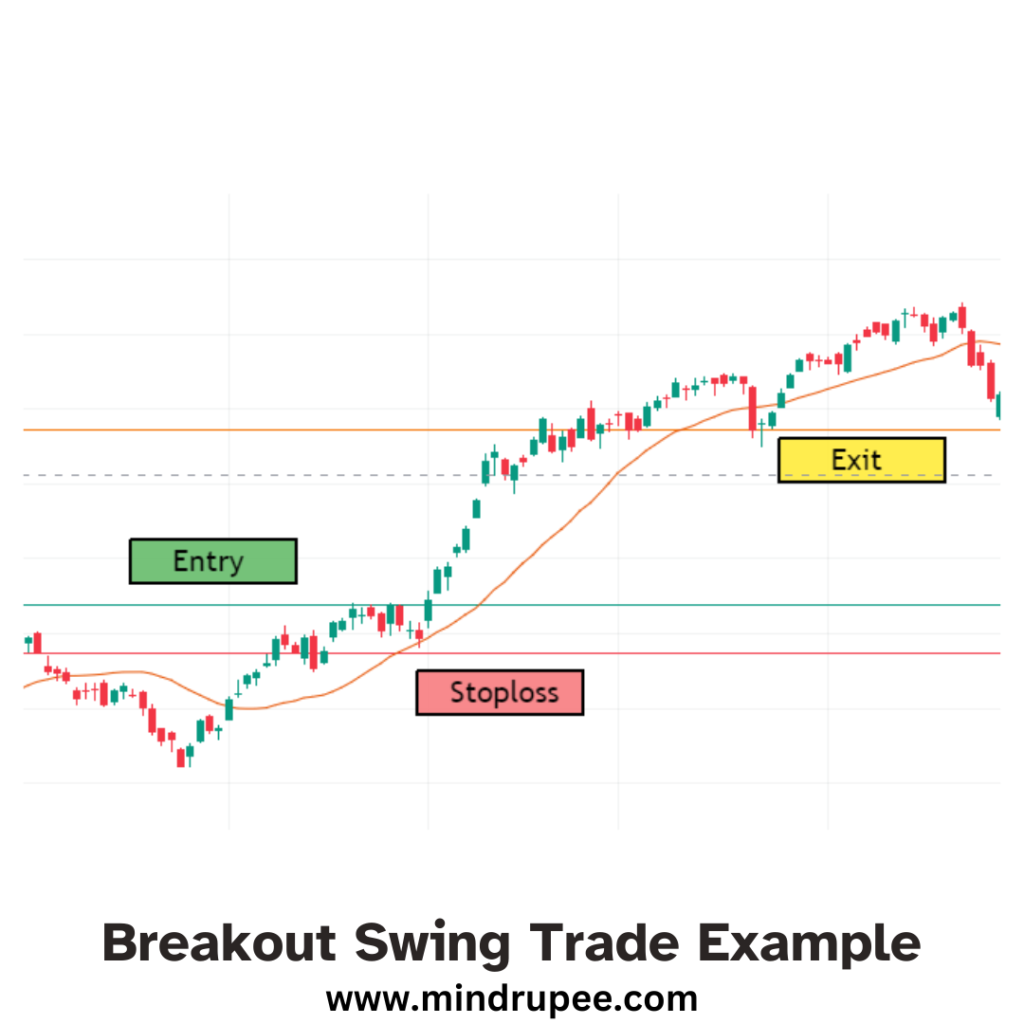
Managing False Breakouts (Fake-outs) A false breakout, or fake-out, happens when the price briefly moves beyond support or resistance but quickly reverses back into the range. False breakouts are common and can trap traders who enter too early.
- Wait for confirmation: Avoid entering a trade the moment price breaks out. Wait for a confirmation candle (a strong close beyond the level) or check whether volume supports the move.
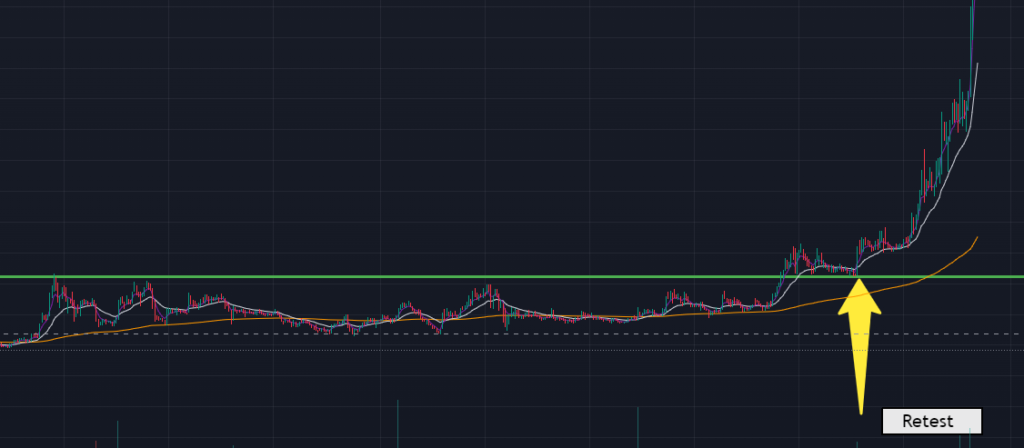
- Use the retest strategy: Sometimes, after a breakout, the price will retest the broken level (former resistance becomes support or vice versa). Entering on the retest gives more confirmation of the breakout’s validity.
Reversal and Bounce Strategies: Timing Your Entry
Reversal and bounce strategies are among the most popular in swing trading. These strategies focus on buying when the price hits a support level and selling when it nears resistance, capitalizing on the natural ebb and flow of the market within a range.
Buy at Support, Sell at Resistance This simple yet effective strategy involves entering a trade when the price touches or bounces off support and exiting (or shorting) when the price approaches resistance. This strategy works best in markets that are trading within a defined range, without strong trends in either direction.

How to Time Entries with Technical Indicators
- RSI (Relative Strength Index): The RSI helps traders determine whether the market is overbought (near resistance) or oversold (near support). For example, when the RSI dips below 30, the market is considered oversold, and there is a higher probability of a bounce from support. Similarly, an RSI reading above 70 indicates an overbought market, increasing the chance of a reversal at resistance.
- Stochastic Oscillator: Like RSI, this indicator can be used to confirm overbought and oversold conditions near key levels.
- Candlestick patterns: Patterns like hammer or engulfing candles near support can signal a potential reversal. Similarly, shooting stars or doji patterns near resistance suggest price exhaustion.
Maximizing Profit Potential in Range Trading
- Entry at support: Look for bullish candlestick patterns or oversold RSI levels before entering a long trade.
- Entry at resistance: If you’re shorting, look for bearish signals like overbought RSI or a bearish candlestick pattern before selling.
- Stop-loss placement: Set a stop just below the support level or above the resistance level to minimize losses in case the level breaks.
Support/Resistance Flip: When Roles Reverse
In technical analysis, a fascinating phenomenon occurs when a broken support level turns into a new resistance level, or a broken resistance level becomes new support. This is known as the support/resistance flip or role reversal.
The Flip Concept When the price breaks through a resistance level, that level often acts as new support on the subsequent retest. Similarly, when support is broken, it often becomes resistance in a falling market. Traders can use this “flip” to their advantage by entering trades on the retest of the flipped level.
For example:
- Resistance turns into support: If the price breaks above resistance at $100, this level now acts as new support. Traders will look to buy the asset if the price pulls back to $100 and holds.
- Support turns into resistance: When the price falls below a key support level, such as $80, that level now acts as resistance. Traders will often look to short the asset if the price retraces to $80 and fails to break above.
How to Use the Flip as a New Entry Point
- Retest entry: After a breakout, wait for the price to retest the former support/resistance level. If the price holds, it offers a lower-risk entry point compared to chasing the initial breakout.
- Confirmation with volume: Volume is again critical. A successful retest with high volume strengthens the case for the flip to hold as a new level.
- Stop-loss placement: Place stops slightly below the new support (in case of a bullish flip) or above the new resistance (for a bearish flip) to minimize risk.
Understanding how to trade support and resistance levels is fundamental to successful swing trading. By mastering breakouts, reversals, and the support/resistance flip, traders can strategically enter and exit positions with greater precision. These strategies not only help manage risk but also maximize profit potential, allowing traders to take full advantage of the natural rhythms of the market.
Advanced Concepts in Support and Resistance
As you progress in swing trading, mastering the basics of support and resistance is just the beginning. More advanced concepts like multiple time frame analysis and supply and demand zones can help you identify stronger, more reliable levels and improve the accuracy of your trades.
Multiple Time Frame Analysis: Identifying Stronger Levels
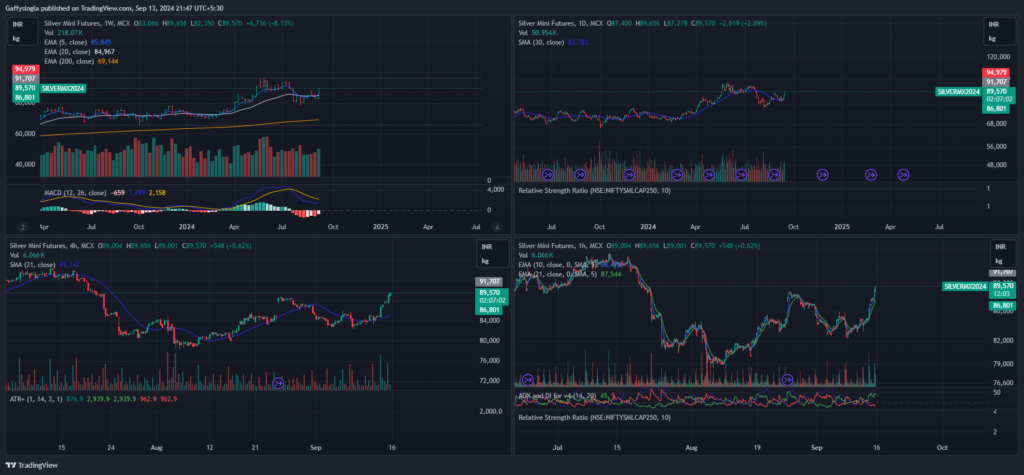
Multiple time frame analysis (MTFA) involves examining support and resistance levels across various time frames, such as daily, weekly, and monthly charts. This approach gives a more comprehensive view of market behavior and helps identify levels that are more likely to hold due to their significance in higher time frames.
Why Higher Time Frames Matter in Swing Trading
- Higher time frames carry more weight: Levels that appear on weekly or monthly charts tend to be stronger than those found on shorter time frames like the 5-minute or 1-hour charts. This is because price levels on longer time frames reflect broader market sentiment and often involve institutional traders, who exert a more powerful influence on price movement.
- Fewer false signals: Short-term support and resistance levels are more prone to noise and false breakouts. Higher time frame levels are more reliable and less likely to be easily breached, making them stronger candidates for swing trading setups.
How to Use Multiple Time Frames in Swing Trading
- Start with the higher time frame (weekly/monthly): Identify key support and resistance levels on higher time frames to get an overarching view of where major price reactions are likely to occur.
- Drill down to a lower time frame (daily/4-hour): Once you have identified key levels on the higher time frame, zoom in on the lower time frames to refine your entry and exit points. For example, if price is approaching a major weekly resistance, check the daily chart for signs of a reversal pattern.
- Combine levels from multiple time frames: When support or resistance levels align across multiple time frames, they carry more significance and offer higher probability trade setups. For instance, if a level appears as resistance on both the weekly and daily charts, it’s likely to be a strong barrier.
Supply and Demand Zones: Beyond Basic Support and Resistance
While traditional support and resistance levels are often based on price history, supply and demand zones focus on areas where large institutional traders place significant buy or sell orders. These zones are typically wider and more powerful than traditional support and resistance levels, providing more accurate trade setups.
What Are Supply and Demand Zones?
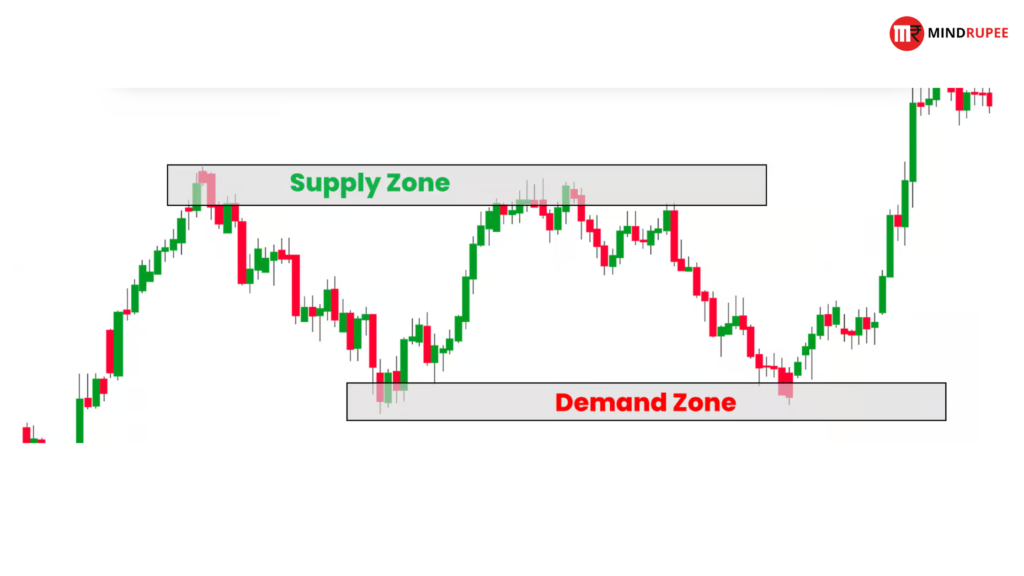
- Supply zone: A price area where there’s a concentration of sell orders, typically causing the price to drop. This zone acts as resistance.
- Demand zone: A price area where there’s a concentration of buy orders, which pushes the price up. This zone acts as support.
Unlike traditional support and resistance lines, which are often drawn at exact price points, supply and demand zones are areas that cover a range of prices. They represent regions where large players (such as institutions or hedge funds) have executed significant buy or sell orders, which lead to strong price movements when revisited.
How Supply and Demand Zones Differ from Traditional Levels
- Institutional activity: Supply and demand zones reflect areas where “smart money” (large institutional traders) has accumulated or distributed large positions. As these players have more capital, they can move the market significantly, creating highly reliable zones.
- Broader range: Unlike the narrow lines used for traditional support and resistance, supply and demand zones cover a range of prices. This makes them more flexible and harder to breach, especially since institutions often spread their orders over a price range.
- Sharper price moves: When price hits a supply or demand zone, the resulting move is usually much sharper and faster compared to traditional support and resistance levels. This is because the large orders that exist in these zones create an imbalance between supply and demand, causing the price to react more violently.
How to Identify Supply and Demand Zones
- Look for sharp price movements: A supply or demand zone typically forms before a strong, rapid price move. For example, if a stock quickly rallies after touching a certain price area, that zone likely represents significant demand.
- Identify consolidation before breakout: Supply and demand zones often form after periods of consolidation, where the price moves sideways before a large breakout. These consolidations indicate areas where institutions are accumulating or distributing their positions.
- Use higher time frames: Like traditional support and resistance, supply and demand zones identified on higher time frames (e.g., daily, weekly) are stronger and more reliable.
Using Supply and Demand Zones in Trade Setups
- Wait for price to return to the zone: Once a supply or demand zone is identified, wait for the price to return to that area before entering a trade. For example, if the price is rallying towards a supply zone, look for a bearish reversal pattern before entering a short trade.
- Set wide stop-losses: Because supply and demand zones cover a range of prices, it’s essential to place stop-losses beyond the entire zone. This minimizes the risk of getting stopped out prematurely.
- Combine with other indicators: To increase the accuracy of your trades, combine supply and demand zones with other indicators like volume, RSI, or moving averages. If price hits a demand zone and RSI is oversold, it strengthens the case for a long entry.
Advanced techniques like multiple time frame analysis and supply and demand zones can significantly improve your ability to identify stronger, more reliable support and resistance levels in swing trading.
By using these methods, you can better align your trades with the actions of large institutional players and increase your chances of capturing larger price moves. These concepts provide a deeper understanding of market dynamics, helping traders refine their strategies and make more informed decisions.
Common Pitfalls in Trading Support and Resistance
While trading support and resistance levels can provide a strategic edge in swing trading, it’s easy to fall into common traps that can lead to losses. Here are some pitfalls to be aware of and tips to avoid them.
Relying Solely on Historical Levels
One of the biggest mistakes traders make is relying solely on historical support and resistance levels without considering current market dynamics. While historical levels are useful, markets are constantly changing due to factors like new information, changes in sentiment, or macroeconomic developments. Blindly following past levels can lead to missed opportunities or unnecessary losses.
Why it’s dangerous:
- Outdated levels: A support or resistance level that worked in the past may no longer be relevant if market conditions have changed (e.g., a shift in trend, news releases, or earnings reports).
- Context matters: Historical levels need to be validated by current price action. A level that was once strong might have weakened due to subsequent price movements or volume shifts.
Tip to avoid this pitfall:
- Always validate historical levels with current price action and volume. Before using a historical support or resistance level, check if the market is reacting to it in the present context. Use additional confirmation signals, such as candlestick patterns or technical indicators like moving averages, to gauge whether the level is still relevant.
Ignoring False Breakouts
A false breakout (also known as a fake-out) occurs when the price moves beyond a support or resistance level, only to reverse and re-enter the previous range. Traders who ignore the possibility of false breakouts can be trapped in losing positions if they enter too quickly after a breakout.
Why it’s dangerous:
- Whipsaw movements: False breakouts can cause a lot of frustration, as price may briefly surge or drop beyond a key level only to reverse shortly after, stopping out traders who entered prematurely.
- Lack of confirmation: Many false breakouts occur when traders jump into a trade without waiting for proper confirmation, mistaking a short-lived price move for a genuine breakout.
Tip to avoid this pitfall:
- Wait for confirmation before entering a breakout trade. Use additional indicators such as volume to confirm the breakout’s strength. A true breakout is typically accompanied by increased volume, while a false breakout occurs on low volume.
- Watch for retests: After a breakout, it’s common for the price to pull back and retest the broken level (resistance turning into support, or vice versa). If the level holds during the retest, it’s a stronger indication of a legitimate breakout, offering a safer entry point.
Overcomplicating Charts
One of the most common pitfalls for traders is overloading their charts with too many indicators, lines, and tools. While it’s tempting to use every tool at your disposal, too much information can lead to analysis paralysis—where traders become overwhelmed by conflicting signals and are unable to make decisive trades.
Why it’s dangerous:
- Confusion and indecision: When there are too many lines, indicators, and zones on your chart, it becomes difficult to interpret what the market is actually doing. This can lead to missed opportunities or poor decisions based on unclear signals.
- Cluttered charts: An overly complicated chart can obscure key information, making it harder to identify the most important support and resistance levels.
Tip to avoid this pitfall:
- Keep your charts clean and simple. Focus on a few well-validated support and resistance levels, trendlines, and a couple of reliable indicators (such as moving averages, RSI, or volume). Strip away anything that doesn’t add clear value to your analysis.
- Prioritize key levels: Not every minor support or resistance is worth plotting. Focus on major, recurring levels that have historically proven to be strong.
To succeed in trading support and resistance, it’s crucial to avoid common pitfalls like over-reliance on historical levels, getting trapped by false breakouts, and overcomplicating your charts. Focus on the present market conditions, use proper confirmation signals for breakouts, and maintain simplicity in your analysis. By staying mindful of these challenges, you can enhance your trading strategy and make more informed decisions.
Conclusion: Mastering the Art of Key Levels
Mastering support and resistance is an essential skill for any successful swing trader. While these levels provide the framework for most trades, how you apply them—and the patience and discipline you bring to the table—will ultimately determine your success.
Patience is Key in Swing Trading
In swing trading, patience is your greatest ally. Waiting for clear signals before entering trades is essential for minimizing risk and maximizing profit potential. Not every support or resistance level will hold, and some may break or fail unexpectedly. For this reason, it’s crucial to wait for confirmation before pulling the trigger on a trade, whether it’s a breakout or a bounce off a key level.
Remember, discipline separates successful traders from the rest. It’s tempting to jump into trades based on emotion or the fear of missing out (FOMO), but it’s important to trust your analysis and wait for the market to give you a clear signal. This approach will not only improve your trade precision but also help protect your capital in the long run.
A Balanced Approach
While support and resistance levels are fundamental, combining them with other technical indicators—such as moving averages, volume, or oscillators like RSI—can significantly enhance the accuracy of your trades.
These additional tools can provide confirmation and help filter out false signals, leading to more informed and confident trading decisions.
Mastering the art of key levels means understanding the market’s psychology and how traders react at specific price points. It’s about reading the story of the market through its price action, and using support and resistance as your guide.
This skill, once developed, will form the backbone of your swing trading strategy and lead to consistent results over time.
We’d love to hear about your experiences with trading support and resistance! What strategies have worked best for you? Feel free to share your thoughts or any challenges you’ve faced in the comments.
And don’t forget to subscribe for more trading strategies, insights, and tips to help you on your trading journey. Happy trading!

