Imagine being able to predict the market’s next move with just a glance.
That’s the power of candlestick patterns—a time-tested tool used by traders to decode price action and spot high-potential trading opportunities.
Whether you’re trading stocks, forex, or crypto, these patterns provide a clear window into market sentiment, helping you catch trends, reversals, and continuations with precision.
In this blog, we’ll explore the essential candlestick patterns every swing trader should know, unlocking the insights you need to sharpen your trading strategy and boost your profits.
Ready to level up your swing trading game?
Let’s dive in!
What Are Candlestick Patterns?
Candlestick patterns are a key tool in technical analysis used by traders to gauge market sentiment and predict potential price movements.
The concept of candlestick charts originated in 17th-century Japan, developed by a rice trader named Munehisa Homma, who is often regarded as the “father of candlestick charting.” He observed that market prices were influenced not only by supply and demand but also by traders’ emotions.
This led to the creation of candlestick patterns, which visually depict price movement during a specific time frame and reflect the psychological battle between buyers (bulls) and sellers (bears).
Why Are Candlestick Patterns Important for Swing Traders?
Candlestick patterns are particularly important for swing traders because they provide immediate visual cues about potential market reversals and trend continuations. By interpreting these patterns, swing traders can anticipate price movements and make well-timed decisions to enter or exit positions.
Swing trading focuses on capturing price movements over several days to weeks, and candlestick patterns are a powerful tool to identify key moments when momentum may shift.
For example, a bullish reversal pattern like the hammer signals that buyers are gaining control, suggesting an upward trend may follow, whereas a bearish engulfing pattern may signal a downward reversal.
Swing traders rely on these patterns to time their trades effectively, taking advantage of the market’s ebb and flow.
By recognizing candlestick patterns at support or resistance levels, they can optimize entry points when the price is poised to rise or set stop-loss orders to manage risk. This visual insight into market sentiment helps traders to capitalize on both upward and downward price movements, making candlestick patterns an essential component of any swing trader’s strategy.
In essence, candlestick patterns give traders a clearer picture of market dynamics and enable them to act quickly, improving the likelihood of executing successful trades.
Key Components of a Candlestick
Candlestick patterns are built from individual candlesticks, each of which provides essential information about price movements within a specific time frame.
Understanding the components of a candlestick is crucial for interpreting the market’s behavior and making informed trading decisions.
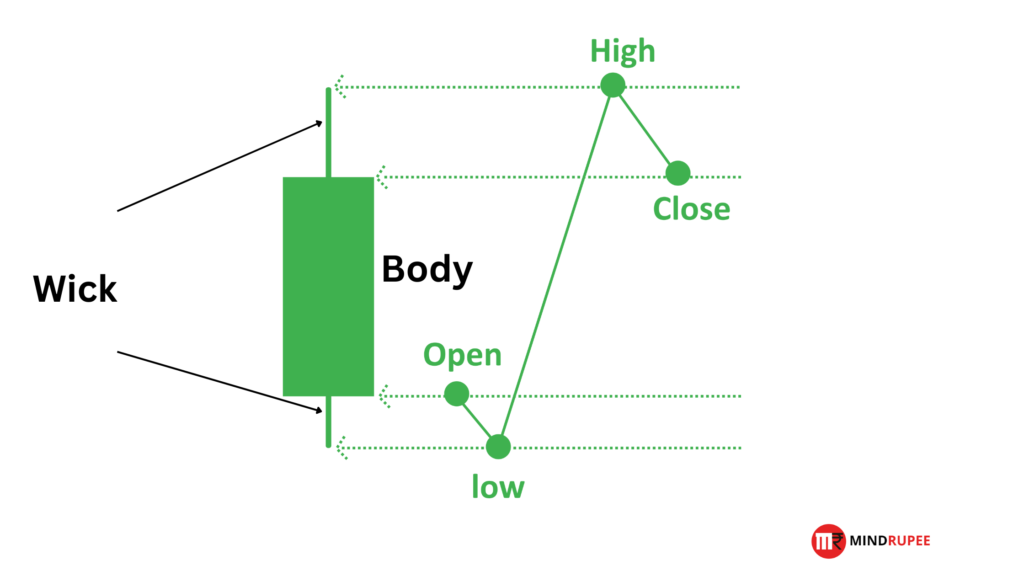
Let’s break down the key elements:
Body
The body of a candlestick represents the difference between the opening and closing prices within a given period, whether it’s one minute, one day, or even one week. The length of the body shows the strength of the price movement within that period.
- Bullish Candles (Green/White Body): If the closing price is higher than the opening price, the body will be green or white, indicating a bullish trend. This suggests that buyers were in control during the time frame, driving prices up.
- Bearish Candles (Red/Black Body): If the closing price is lower than the opening price, the body will be red or black, signaling a bearish trend. This means sellers were dominant, pushing prices down.
Wicks (Shadows)
The wicks (also called shadows) are the thin lines extending from the body, which represent the highest and lowest prices reached during the trading period.
- Upper Wick: The highest price the asset reached during the period. If the upper wick is long, it suggests that buyers tried to push the price higher but were eventually overpowered by sellers.
- Lower Wick: The lowest price the asset reached during the period. A long lower wick suggests that sellers attempted to drive the price lower, but buyers regained control and pushed the price back up.
Colors
The color of the candlestick body is a quick visual indicator of whether the market is in an uptrend or downtrend during the given period.
- Green (Bullish): A green candlestick indicates that the asset’s price increased during the time frame (close > open), which is a bullish signal. It reflects the dominance of buyers, often signaling a continuation of an upward movement or the start of a reversal from a downtrend.
- Red (Bearish): A red candlestick shows that the asset’s price decreased during the time frame (close < open), which is a bearish signal. It demonstrates the power of sellers, often indicating a downtrend or a potential reversal from an uptrend.
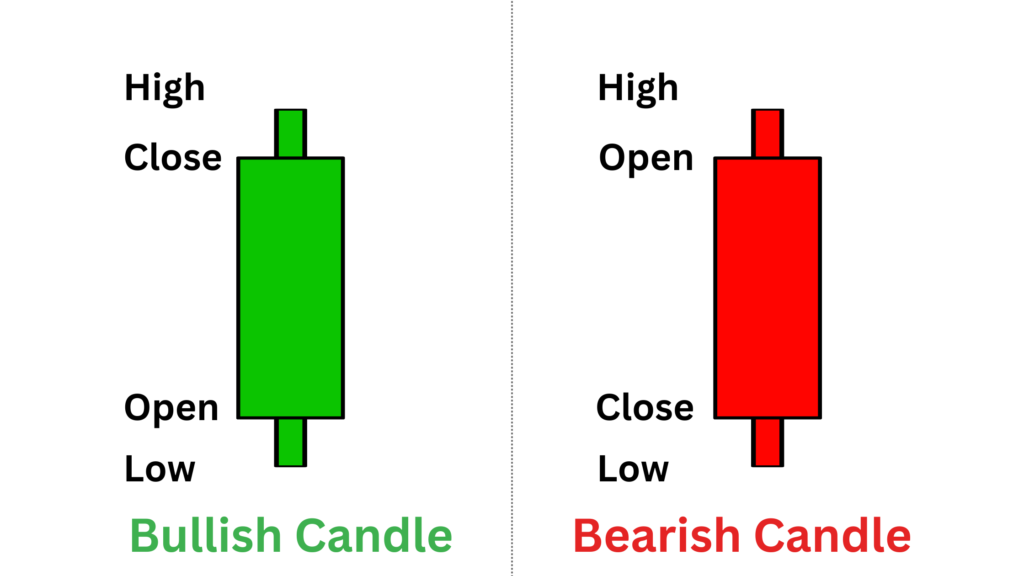
Understanding these components—body, wicks, and colors—allows traders to interpret the market sentiment effectively. The shape and size of the candlesticks, combined with their placement in the overall chart, help swing traders identify trends, reversals, and potential price movements. By learning to read candlestick formations, traders can make more accurate predictions about future market behavior and refine their entry and exit points.
Most Reliable Candlestick Patterns for Swing Trading
While there are many patterns, some are particularly reliable for swing trading, providing clear signals of potential reversals or trend continuations. Below are some of the most reliable candlestick patterns, as well as insights into their use by professional traders.
Which Candlestick Pattern Is Most Reliable for Swing Trading?
Here are some of the most trusted and reliable candlestick patterns for swing trading:
Engulfing Patterns (Bullish and Bearish)
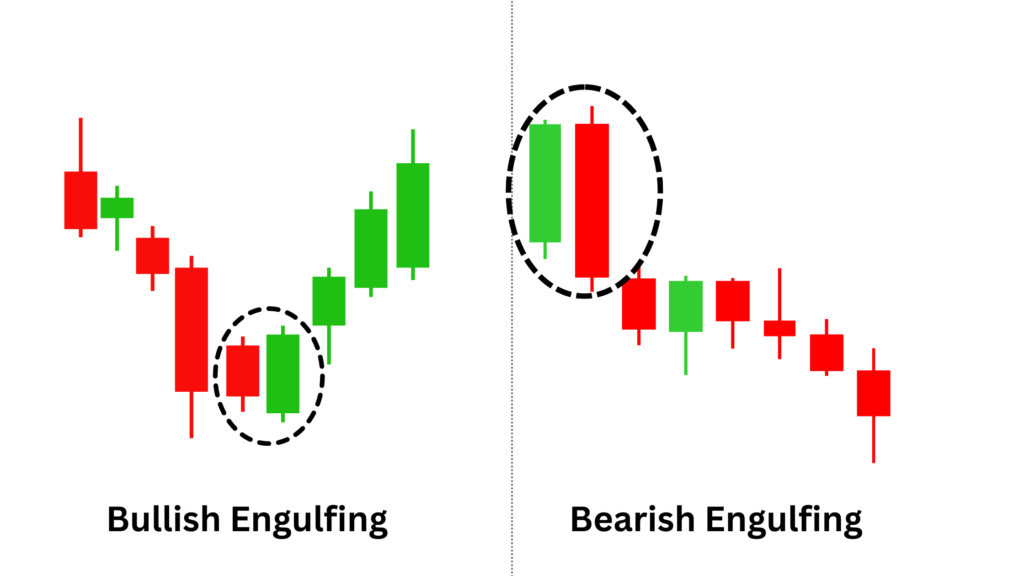
- Bullish Engulfing: This pattern occurs when a small bearish candle is followed by a large bullish candle that completely engulfs the previous candle. It signals a strong shift in momentum from sellers to buyers, indicating a potential upward reversal.
- Bearish Engulfing: In contrast, this occurs when a small bullish candle is followed by a large bearish candle that engulfs the previous one, signaling a potential downward reversal.
- Why Reliable?: Engulfing patterns are highly reliable when confirmed by strong volume. They show a decisive change in market sentiment.
Hammer & Inverted Hammer
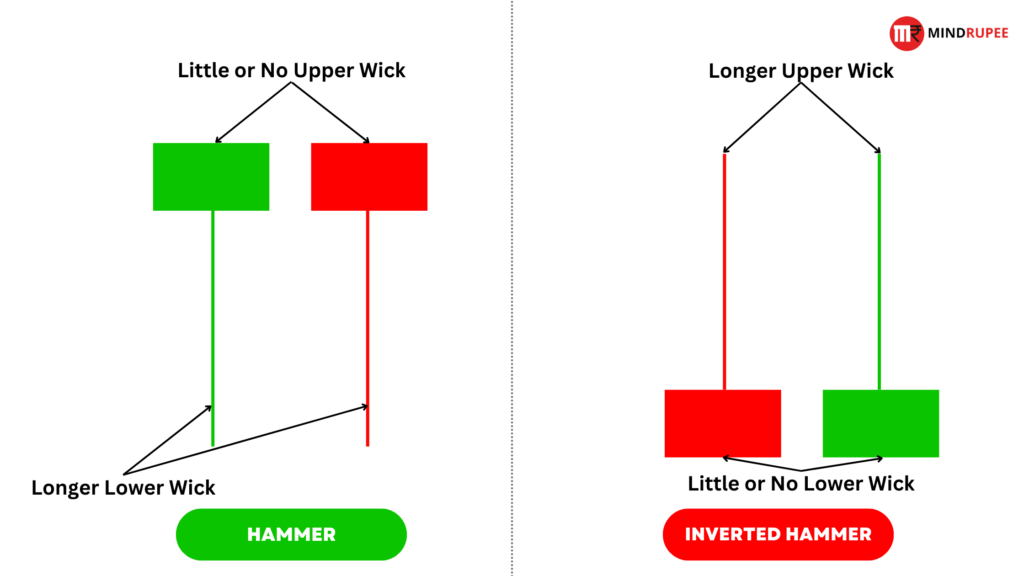
- Hammer: This bullish reversal pattern appears after a downtrend and is identified by a small body with a long lower wick. The long wick indicates that sellers pushed the price down, but buyers regained control and drove it back up.
- Inverted Hammer: This pattern also indicates a bullish reversal but features a small body and a long upper wick. It signals that buyers attempted to push the price higher and sellers couldn’t maintain control.
- Why Reliable?: Both patterns signal the potential exhaustion of a downtrend, making them powerful indicators for swing traders looking to capitalize on trend reversals.
Shooting Star
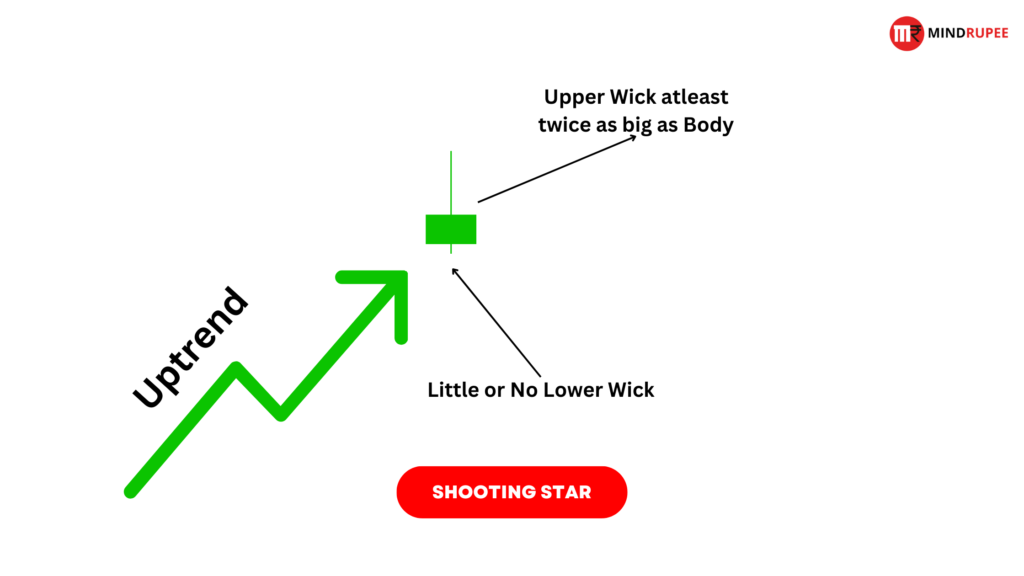
- Description: A bearish reversal pattern that forms after an uptrend. The candlestick has a small body and a long upper wick, showing that buyers tried to push the price higher, but sellers took over by the close.
- Why Reliable?: The Shooting Star is effective for spotting bearish reversals, especially when accompanied by high trading volume, confirming the weakening momentum of the uptrend.
Three Green/White Soldiers
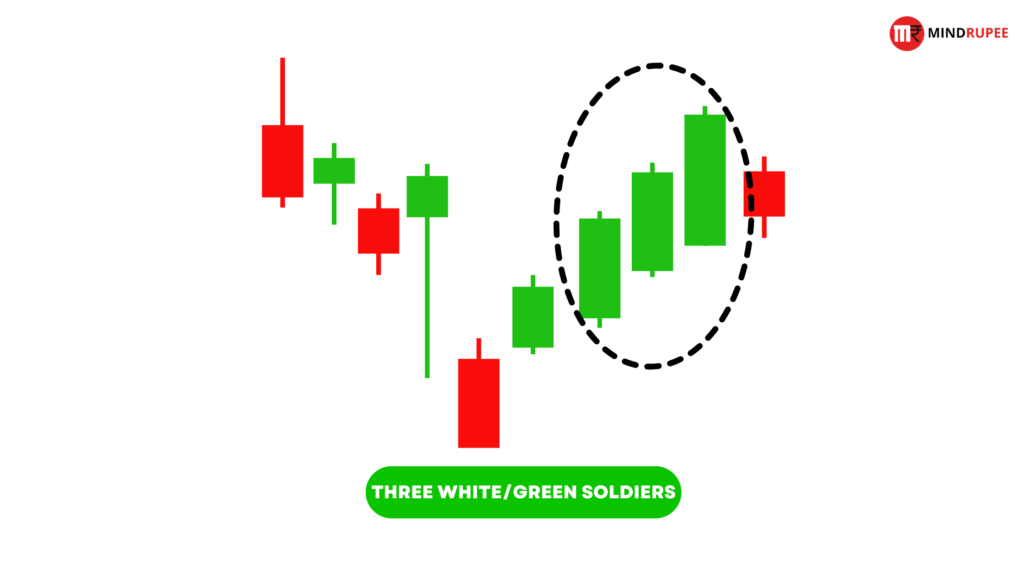
- Description: This is a bullish continuation pattern that forms when three consecutive long green (bullish) candlesticks appear, each opening higher than the previous candle. It signals sustained buying pressure and strong upward momentum.
- Why Reliable?: The pattern is reliable for identifying strong upward trends and potential breakout opportunities for swing traders.
Rarest Candlestick Pattern
Abandoned Baby
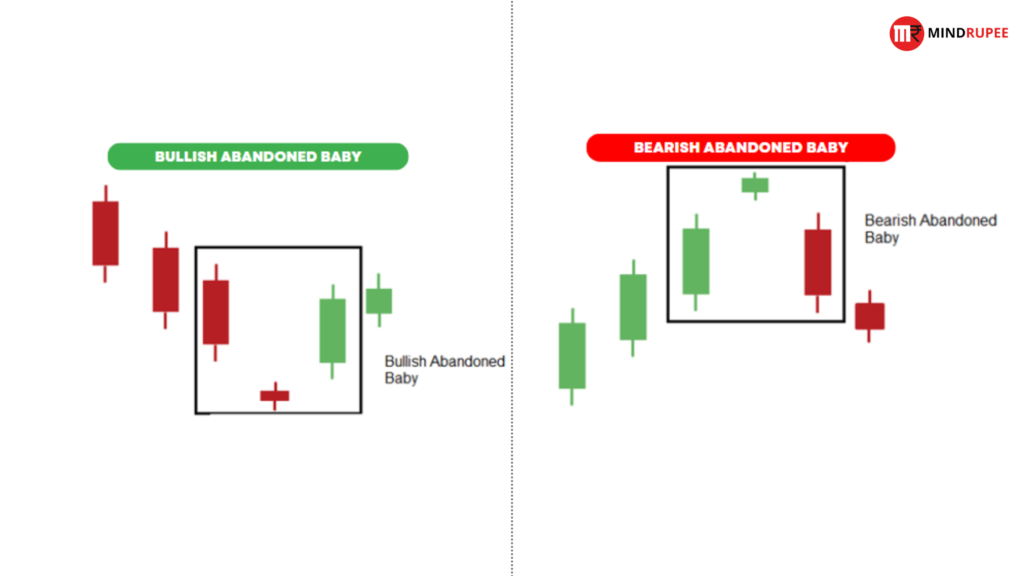
- Description: The Abandoned Baby pattern is a rare but powerful reversal signal. It consists of three candles: a large candle in the direction of the trend, followed by a Doji (which indicates indecision), and a large candle in the opposite direction. It forms when there is a gap between the Doji and the two large candles.
- Why Rare?: Due to the specific conditions required for its formation (gaps and a Doji), the Abandoned Baby pattern is rarely seen, but when it does occur, it signals a strong potential reversal, especially in high-volume markets.
Do Professional Traders Use Candlestick Patterns?
Yes, professional traders frequently use candlestick patterns as part of their overall trading strategy. However, they typically combine these patterns with other technical tools, such as volume analysis, moving averages, and trend lines, to confirm the strength of the signals. Candlestick patterns alone might not always be reliable in isolation, but when supported by other technical indicators, they can provide valuable insights for precise trade entries and exits.
- Volume Confirmation: Professional traders often look for volume confirmation alongside candlestick patterns. A high volume with an Engulfing pattern, for example, can significantly strengthen the reliability of the signal.
- Multi-Time Frame Analysis: Pro traders also use multiple time frames to confirm the strength of a candlestick pattern. A pattern seen on both a daily and a weekly chart, for instance, holds greater weight.
In conclusion, while candlestick patterns are highly effective for swing trading, their true power is unlocked when combined with other technical analysis tools and confirmed by volume and market context.
Top Candlestick Patterns Every Swing Trader Should Know
Swing traders rely heavily on candlestick patterns to anticipate potential market moves and identify trading opportunities. Below is a detailed breakdown of the most important bullish, bearish, and continuation patterns that swing traders should be familiar with.
Bullish Patterns
These candlestick formations signal potential upward reversals, making them crucial for swing traders who want to enter long positions after a downtrend.
Hammer
- Description: A small-bodied candle with a long lower wick, signaling a potential reversal after a downtrend. It shows that sellers initially pushed the price lower, but buyers stepped in to push it back up.
- Interpretation: Indicates that the selling pressure has diminished, and buying pressure may drive the price upward.
Inverted Hammer
- Description: This pattern forms at the end of a downtrend and is identified by a small body with a long upper wick. The long wick shows that buyers attempted to push prices higher.
- Interpretation: While selling pressure was still present, the buyers have gained enough strength to signal a potential upward reversal.

Bullish Engulfing
- Description: A large bullish candle that completely engulfs the body of the prior bearish candle.
- Interpretation: Signals a strong shift in sentiment from sellers to buyers, and often occurs at the bottom of a downtrend, indicating a potential bullish reversal.

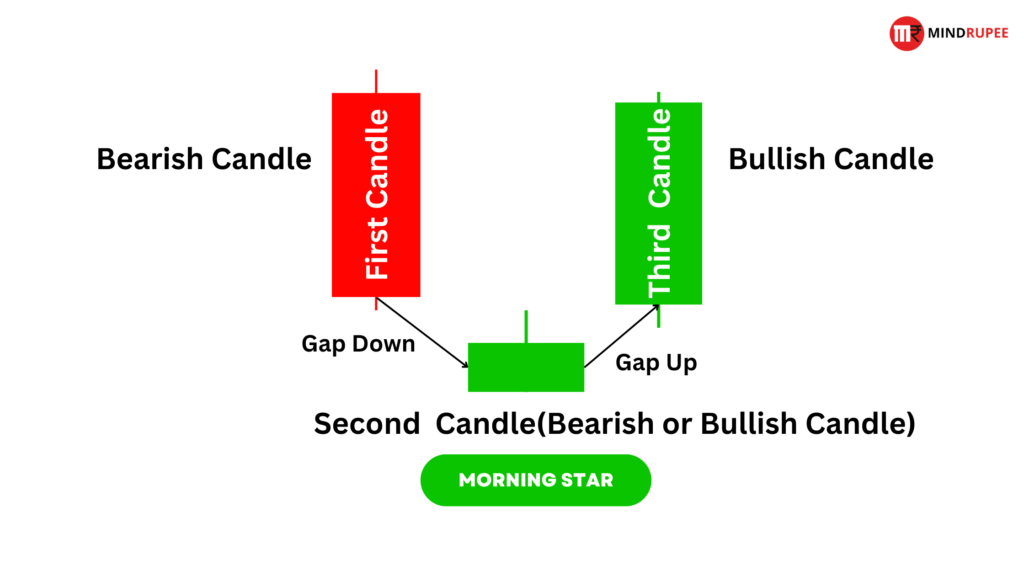
Morning Star
- Description: A three-candle pattern that indicates a reversal after a downtrend. It consists of a large bearish candle, a small indecisive candle (often a Doji), followed by a large bullish candle.
- Interpretation: Shows that selling momentum is weakening, and buying pressure is starting to take over.
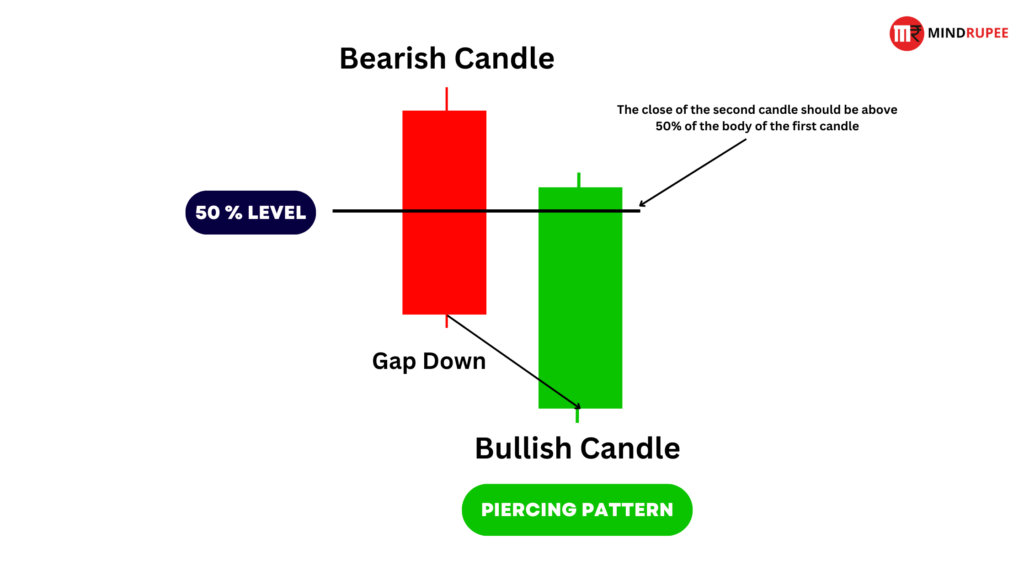
Piercing Pattern
- Description: A two-candle bullish reversal pattern. The first candle is bearish, and the second bullish candle opens lower but closes more than halfway into the previous bearish candle.
- Interpretation: Indicates that buyers are taking control, reversing the prior bearish sentiment.
Three White Soldiers
- Description: Three consecutive long bullish candles, each closing higher than the previous one.
- Interpretation: This pattern indicates sustained buying pressure and is a strong signal of an upward trend continuation.

Bearish Patterns
Bearish candlestick patterns indicate the potential for downward reversals, giving swing traders opportunities to take short positions or exit long trades.
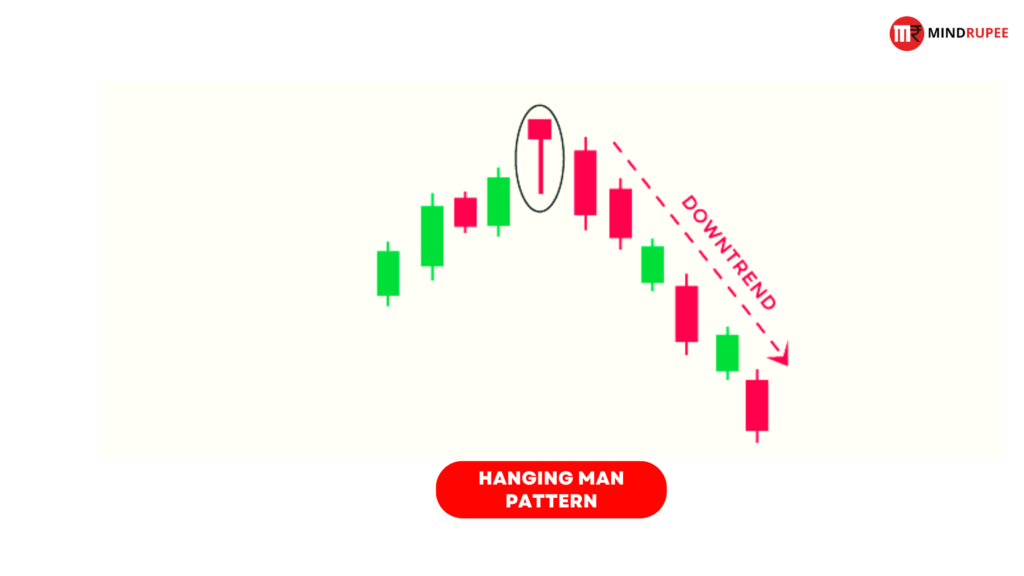
Hanging Man
- Description: A candlestick pattern that forms at the end of an uptrend, similar to the Hammer but signals a bearish reversal. It has a small body with a long lower wick.
- Interpretation: Indicates that selling pressure is starting to dominate, which could result in a downward trend.
Shooting Star
- Description: A small-bodied candle with a long upper wick, appearing after an uptrend. The long wick indicates that buyers pushed prices higher, but sellers took control by the close.
- Interpretation: Suggests that buying momentum is fading, signaling a potential bearish reversal.

Bearish Engulfing
- Description: A large bearish candle that completely engulfs the previous bullish candle.
- Interpretation: This pattern shows a strong reversal of market sentiment from buyers to sellers and is an excellent signal for a downtrend.

Evening Star
- Description: The bearish counterpart to the Morning Star. It consists of a large bullish candle, a small indecisive candle, and a large bearish candle.
- Interpretation: Indicates that the uptrend is losing steam and a bearish reversal may occur.

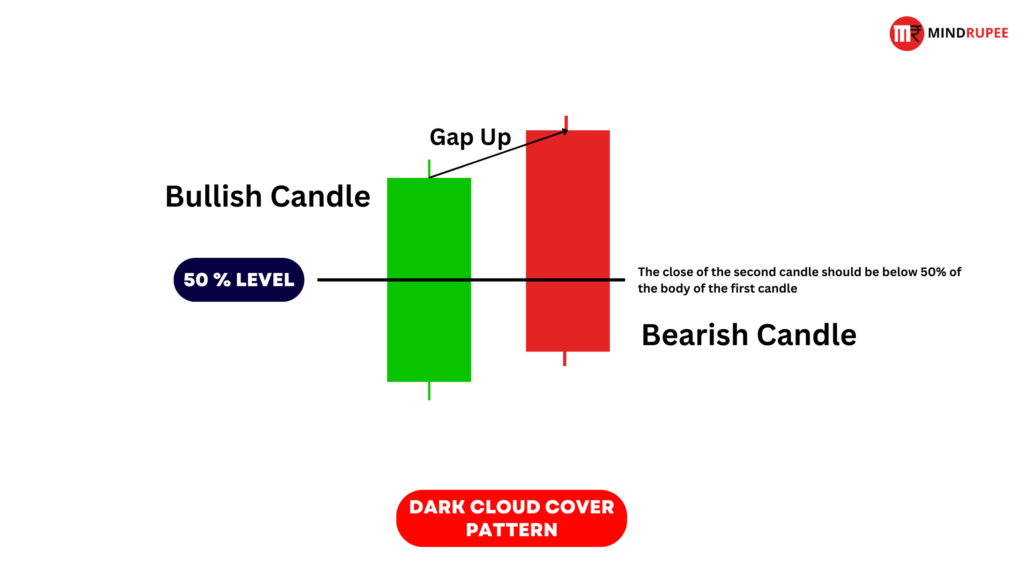
Dark Cloud Cover
- Description: A two-candle pattern where the first candle is bullish, and the second bearish candle opens higher but closes below the midpoint of the first candle.
- Interpretation: Signals a bearish reversal, indicating that selling pressure is overtaking buying pressure.
Continuation Patterns
Continuation patterns signal that the current trend is likely to continue, making them valuable for swing traders looking to capitalize on established trends.
Doji
- Description: A candlestick pattern where the open and close prices are almost the same, creating a small body with long wicks.
- Interpretation: Reflects market indecision, often seen before a continuation of the current trend, though it can also signal a potential reversal.

Spinning Top
- Description: A candlestick with a small body and long wicks on both sides, representing market indecision.
- Interpretation: Like the Doji, the Spinning Top suggests that neither buyers nor sellers have control, which may lead to a continuation of the trend or a pause in momentum.
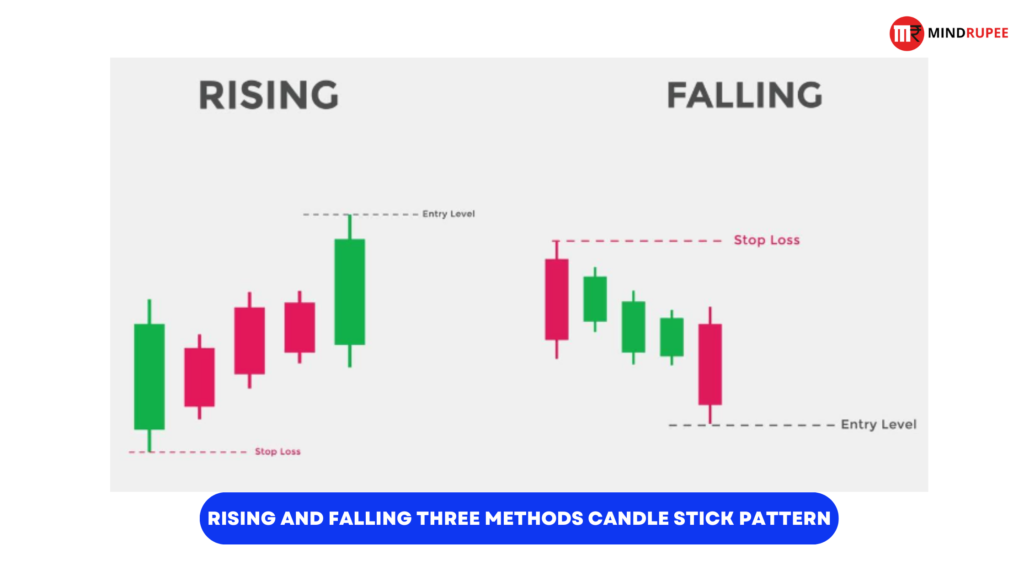
Rising and Falling Three Methods
- Description: The Rising Three Methods consists of a long bullish candle, followed by three smaller bearish candles, and then another large bullish candle. The Falling Three Methods is the reverse, with bearish candles dominating.
- Interpretation: Both patterns indicate a brief consolidation within a longer-term trend, followed by a continuation of the trend direction.
Historical Perspective on Candlestick Patterns
Who Is the Father of Candlestick Patterns?
Munehisa Homma, an 18th-century rice trader from Japan, is widely regarded as the father of candlestick charting. Homma developed the first known form of technical analysis to predict rice market prices by studying the psychology of buyers and sellers. His groundbreaking insights laid the foundation for candlestick patterns, which are still used by traders globally to interpret market behavior.
Homma’s observations were that the emotions and psychology of traders greatly influenced price movements. He used visual representations of these price fluctuations, which evolved into the candlestick charts we use today. By capturing market sentiment through the relationship between opening, closing, high, and low prices, Homma revolutionized the way traders analyze markets.
Homma’s work went beyond simple price action and touched on market psychology, where he recognized that emotions like fear and greed impacted market trends. His innovative approach to technical analysis became a cornerstone for modern trading strategies, including swing trading.
Homma’s contribution to trading is so impactful that many of the patterns he identified, such as the Doji, Hammer, and Engulfing patterns, are still considered essential by traders worldwide. His approach highlighted the importance of interpreting market sentiment and price action, helping traders anticipate future price movements and shifts in momentum.
Candlestick patterns, based on Homma’s work, provide a rich history and deep insight into human behavior in financial markets. Over time, these patterns have become a universal tool used across multiple financial markets, from stocks to commodities and forex.
How to Identify Strong Candlestick Patterns
Volume Confirmation
One of the most critical factors in identifying the strength of a candlestick pattern is the trading volume. Strong candlestick patterns, whether bullish or bearish, are typically confirmed by high trading volume. When a candlestick pattern forms with a significant spike in volume, it suggests that a large number of participants are driving the market in the direction indicated by the pattern. For example, a Bullish Engulfing pattern accompanied by a surge in volume signals that buyers are stepping in forcefully, increasing the likelihood of a trend reversal.
Market Context
Candlestick patterns are more reliable when they occur within a broader market context, such as at key support or resistance levels. For example, if a Hammer pattern forms at a long-term support level, it carries more weight, as this level has historically acted as a price floor where buyers step in. Similarly, a Shooting Star pattern that appears at a significant resistance level is more likely to indicate a strong reversal, as sellers may begin to overwhelm buyers at this point.
Incorporating trend lines, moving averages, or Fibonacci retracements into your analysis can provide additional confirmation and improve the reliability of candlestick patterns.
Multiple Time Frame Analysis
Using multiple time frames can further strengthen the reliability of candlestick patterns. For example, if you spot a bullish reversal pattern like a Morning Star on a daily chart, check the 4-hour or hourly chart to see if the price action aligns with this reversal on a smaller scale. When patterns align across different time frames, the probability of a successful trade increases.
For instance, a Bullish Engulfing pattern on a daily chart, confirmed by an Inverted Hammer on an hourly chart, suggests a stronger and more credible potential reversal. This technique helps swing traders avoid false signals that might appear on shorter time frames.
In summary, the strength of a candlestick pattern is determined not only by its formation but by the volume behind it, the context in which it forms, and how it aligns with price action across multiple time frames. When these elements come together, candlestick patterns become a powerful tool in a swing trader’s arsenal.
Candlestick Trading Rules Explained
What Is the 3-Candle Rule in Trading?
The 3-candle rule is a method used by traders to confirm trends or reversals before entering a trade. According to this rule, traders wait for three consecutive candles in the same direction (bullish or bearish) to confirm the trend’s strength or a reversal. This helps traders avoid prematurely entering trades based on single candles that may not fully indicate a solid trend. For example, after a downtrend, if three bullish candles form consecutively, it can suggest the beginning of an upward trend.
What Is the 84 Rule for Candles?
The 84 rule indicates that when a candle closes at 84% or more of its total range, it signifies strong momentum in the direction of the close. For instance, if a bullish candle closes at 84% of its high, it shows strong buying pressure and an increased likelihood that the upward momentum will continue in the next candle. This rule helps traders gauge the strength of the market at the close of the candle and decide whether to enter or hold their position.
What Is the 5-Candle Rule?
The 5-candle rule advises traders to wait for five consecutive candles in the same direction to confirm the validity of a trend. This rule is especially useful for filtering out false breakouts that may occur with fewer candles. For example, if a breakout occurs but only lasts for two candles, it may be a false signal. However, if the breakout continues for five consecutive candles, it strengthens the trader’s confidence that the breakout is genuine.
What Is the 8-10 Candle Rule?
The 8-10 candle rule helps traders assess the strength or exhaustion of a trend. It suggests observing 8 to 10 consecutive candles to determine if the trend is likely to continue or reverse. If a trend sustains itself over 8-10 candles without significant pullbacks, it often indicates strong market sentiment and trend continuation. Conversely, if the trend weakens over this period, traders may anticipate an upcoming reversal or consolidation. This rule is particularly useful for swing traders aiming to ride trends while avoiding early exits.
Together, these candlestick rules offer swing traders practical methods to confirm trends, assess market momentum, and improve their trade timing for better risk management and higher probability trades.
Additional Candlestick Patterns for Swing Trading
Three Black Crows
The Three Black Crows is a bearish reversal pattern made up of three consecutive bearish candles, each closing lower than the previous one. This pattern typically appears after an uptrend and signals strong selling pressure, indicating that the bulls have lost control, and a downtrend may be imminent. The candles should ideally have small wicks, further confirming the strength of the bears. This pattern helps traders anticipate a reversal, allowing them to exit long positions or consider entering short trades.
Kickers
The Kicker pattern is a highly reliable reversal pattern and indicates a sudden and sharp change in market sentiment. A kicker occurs when a large bullish or bearish candle is followed by a gap and then a candle moving sharply in the opposite direction. The gap and the immediate reversal signal that a strong shift in market sentiment has occurred, often driven by major news or events. This pattern alerts swing traders to potential sharp reversals, offering excellent entry opportunities.
Rising/Falling Window
The Rising Window and Falling Window patterns represent gaps between two consecutive candles. In a Rising Window, the second candle opens higher than the previous candle’s close, leaving a gap, which suggests bullish momentum and a potential continuation of the upward trend. The Falling Window is the opposite, where the second candle opens lower, leaving a gap and indicating strong bearish sentiment. These gaps act as signals for swing traders to anticipate the continuation of the current trend and potentially enter trades aligned with that momentum.
Marubozu
A Marubozu is a single-candle pattern with no wicks, meaning the price opens at the high or low and closes at the extreme opposite. A bullish Marubozu (open at low, close at high) indicates strong buying pressure, while a bearish Marubozu (open at high, close at low) reflects strong selling pressure. The absence of wicks in this pattern makes it a powerful indicator of market dominance by either buyers or sellers, signaling a trend’s momentum. Swing traders can use this pattern to confirm strong trends and potential breakouts.
Harami
The Harami is a two-candle reversal pattern where the second candle is completely contained within the body of the first candle. In a bullish Harami, a small bullish candle follows a large bearish candle, signaling a potential reversal to the upside. Conversely, in a bearish Harami, a small bearish candle follows a large bullish candle, indicating that the uptrend may be losing strength. This pattern helps swing traders spot potential trend reversals, especially when combined with other technical indicators like volume or support/resistance levels.
These additional candlestick patterns provide swing traders with more tools to identify trend reversals, market momentum shifts, and potential breakouts. When used alongside other indicators and trading strategies, these patterns enhance a trader’s ability to make more informed decisions.
Benefits of Candlestick Patterns for Swing Trading
High Accuracy
Candlestick patterns are highly effective in pinpointing potential market reversals, continuations, and shifts in market sentiment. They provide a visual representation of price movement, making it easier for traders to quickly identify trading opportunities. Swing traders can use these patterns to determine entry and exit points with greater precision, which improves the likelihood of making profitable trades. The clarity offered by candlestick patterns helps traders make decisions faster and more confidently.
Applicability Across Multiple Markets
Candlestick patterns are universal in nature and can be used across a wide range of financial markets, including stocks, forex, commodities, and cryptocurrencies. This versatility makes them an essential tool for swing traders, as the principles of candlestick charting apply regardless of the asset being traded. This adaptability allows traders to transition between different markets while relying on a consistent technical foundation.
Ease of Interpretation
One of the primary advantages of candlestick patterns is their simplicity. Once traders become familiar with the most common patterns, they can quickly assess price action and market sentiment with ease. The visual and straightforward nature of these patterns reduces the complexity often associated with more intricate technical analysis methods, allowing swing traders to recognize trends and potential reversals efficiently. This makes candlestick patterns particularly valuable for traders seeking a streamlined approach to market analysis.
Drawbacks of Candlestick Patterns
Potential for False Signals
Although candlestick patterns can be highly reliable, they are susceptible to generating false signals, particularly in low-volume markets or during periods of high volatility. In these conditions, price fluctuations may form patterns that look promising but fail to lead to profitable trades. Traders must be mindful of the risk of misinterpreting these signals and take into account market liquidity and external factors such as news events that can influence price movements unexpectedly.
Need for Confirmation
Candlestick patterns should not be used as a standalone trading strategy. To enhance their reliability, they should be combined with other technical indicators like the Relative Strength Index (RSI), Moving Average Convergence Divergence (MACD), and support and resistance levels. These additional tools help confirm trade setups, significantly reducing the risk of acting on a potentially misleading pattern. Traders should use candlestick patterns as part of a broader technical analysis toolkit to increase the probability of successful trades.
Demand for Continuous Monitoring
Effectively using candlestick patterns in swing trading requires constant chart monitoring, especially on shorter time frames. Markets can change rapidly, and a delay in acting on a pattern may result in missed trading opportunities or increased exposure to risk. This constant need for vigilance can be time-consuming and may require a high level of focus and dedication, making it challenging for traders who cannot monitor the markets consistently throughout the day.
Tips for Effective Use of Candlestick Patterns
Combine Patterns with Technical Indicators
To enhance the accuracy and reliability of candlestick patterns, it’s essential to use them alongside technical indicators like the Relative Strength Index (RSI), Moving Average Convergence Divergence (MACD), and moving averages. These indicators help confirm the strength of the pattern and provide additional insights into market momentum and potential reversals. For example, a bullish engulfing pattern confirmed by a rising RSI provides a stronger signal for a potential upward move.
Look for Confluence
Candlestick patterns become more powerful when they align with other technical signals, such as support and resistance levels, trendlines, or Fibonacci retracement levels. When multiple signals point to the same market movement, the probability of success increases significantly. For instance, a hammer forming at a key support level offers a higher confidence trade than just relying on the pattern itself.
Practice Risk Management
No trading strategy is foolproof, and candlestick patterns can fail. Therefore, it’s crucial to implement proper risk management by always using stop-loss orders to protect against adverse market movements. A stop-loss helps limit potential losses if a pattern fails to play out as expected. It’s also wise to position size accordingly, ensuring that any single trade doesn’t put too much of your trading capital at risk.
Conclusion: The Role of Candlestick Patterns in Swing Trading
Summary
Candlestick patterns are an integral tool for swing traders, offering a visual representation of market sentiment and providing insights into potential price trends, reversals, and continuations. They allow traders to capitalize on short- to medium-term price movements, making them invaluable for identifying key entry and exit points. However, candlestick patterns should not be used in isolation; combining them with other technical tools and strategies enhances their reliability.
Final Thoughts
Candlestick patterns offer clarity and structure in the often chaotic world of trading, but they must be used alongside other technical analysis tools and proper risk management strategies. Traders should always seek confirmation from indicators like RSI, MACD, and moving averages before executing trades. Additionally, practicing and back testing strategies on historical data can help traders refine their approach and gain confidence before applying these patterns in live markets.
While candlestick patterns can significantly enhance a swing trader’s toolkit, patience, discipline, and continuous learning are essential for long-term success.


