Swing trading is all about timing. Unlike long-term investing, swing traders focus on capturing short- to medium-term price movements, often holding positions for days or weeks.
But how do traders know when to enter or exit trades?
This is where chart patterns come into play.
These patterns, formed by the price movement of an asset, offer visual clues about where the market is headed next.
Whether you’re looking for signs of a trend reversal or continuation, mastering these chart patterns can significantly enhance your ability to make profitable trades.
In this blog, we’ll dive deep into the most powerful chart patterns used by swing traders to navigate the markets with confidence.
What Are Chart Patterns?
Definition of Chart Patterns
Chart patterns are graphical formations created by the price movements of a financial asset over time, typically on a candlestick or line chart.
They represent the collective sentiment and behavior of market participants, such as buyers and sellers, and provide traders with insight into potential future price directions.
By identifying specific patterns, traders can make educated predictions about market movements, whether it’s a continuation of the current trend or a potential reversal.
Types of Chart Patterns
There are two main types of chart patterns:
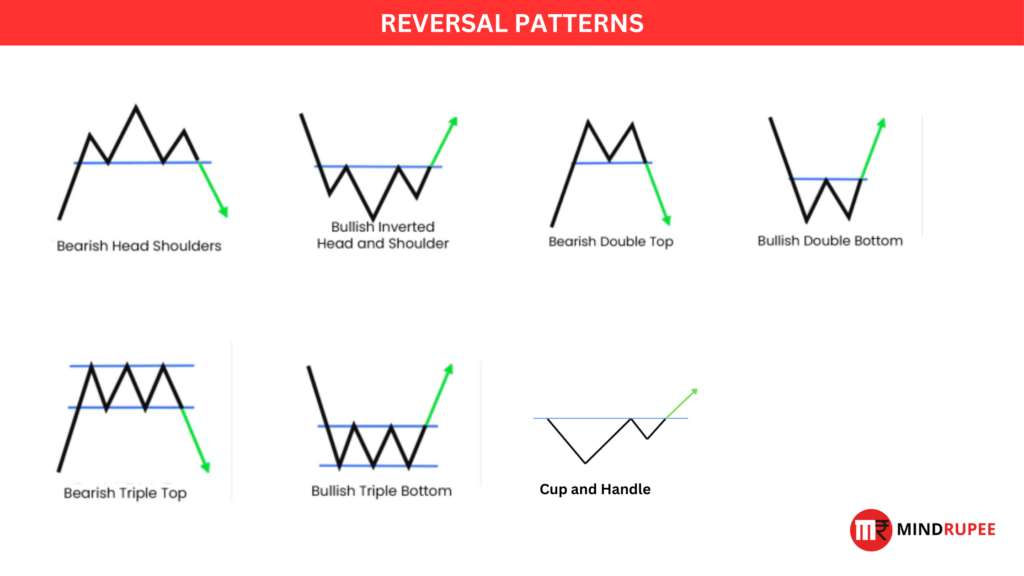
- Reversal Patterns: These patterns signal a potential change in the direction of the prevailing trend. For instance, after an uptrend, a reversal pattern may indicate a future downtrend, and vice versa.
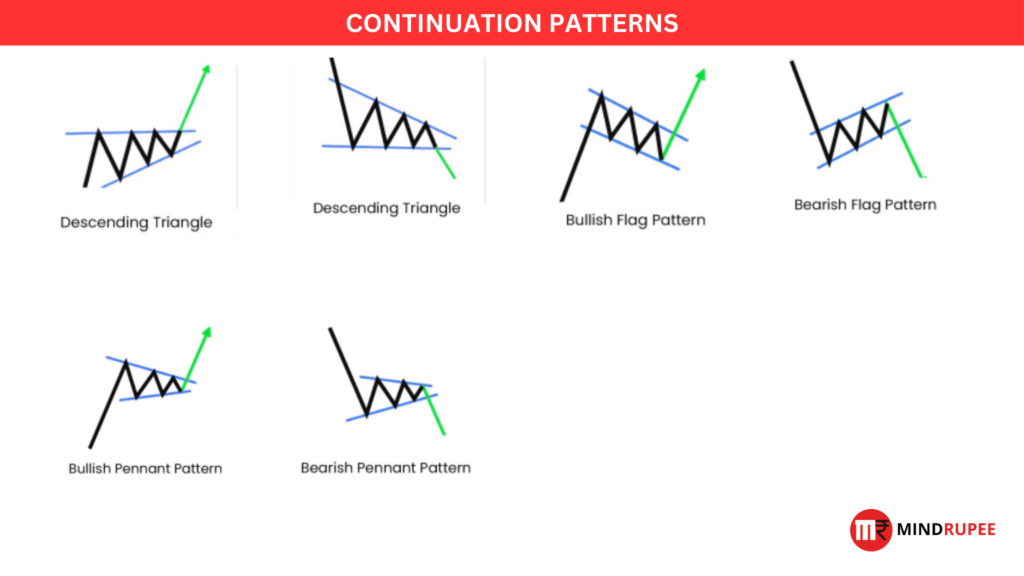
- Continuation Patterns: These patterns suggest that the current trend is likely to continue once the pattern is completed. They act as pauses in the trend, often indicating a consolidation phase before the next price movement.
How Chart Patterns are Formed?
Chart patterns form as a result of the collective actions of market participants—buying and selling—over time.
When enough traders react similarly to market events, price fluctuations create recognizable formations.
These formations capture shifts in market sentiment, making them valuable tools for predicting future movements.
Understanding the psychology behind these patterns is key to interpreting them effectively and using them to inform trading decisions.
Why Chart Patterns Matter in Swing Trading?
Chart patterns are essential tools in swing trading because they offer visual cues that help traders anticipate future price movements. By identifying these patterns, traders can:
- Predict Price Movements: Chart patterns provide insights into market sentiment, helping traders forecast whether the price will rise, fall, or continue in the same direction.
- Identify Trend Shifts: Reversal patterns help traders spot when a trend is about to change direction, allowing them to time their trades more effectively.
- Optimize Entry and Exit Points: Continuation patterns offer clear signals for entering or exiting trades, giving swing traders precise moments to make decisions that maximize profits or minimize losses.
- Enhance Risk Management: By using patterns, traders can set more accurate stop-loss levels, reducing the risk of large losses.
In swing trading, technical analysis plays a critical role in making informed trading decisions. Chart patterns form the backbone of this analysis by revealing important market signals.
They act as roadmaps for traders, offering insights into the current market direction and highlighting potential turning points.
By incorporating chart patterns into technical analysis, swing traders can base their decisions on data-driven trends rather than emotional reactions, making their trades more consistent and reliable.
Essential Chart Patterns for Swing Traders
Here’s a detailed breakdown of essential chart patterns that swing traders use to make informed decisions.
Reversal Patterns
Reversal patterns indicate that a prevailing trend is about to change direction. These patterns help swing traders identify points where a trend might reverse, allowing them to position themselves for maximum profit.
Head and Shoulders
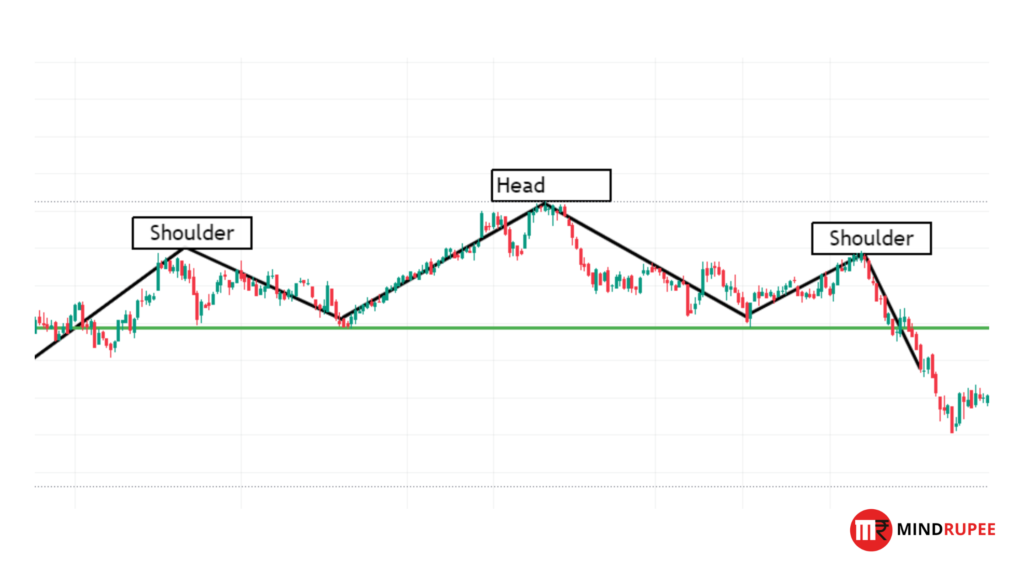
- Description: The head and shoulders pattern signals the end of an uptrend and indicates a potential bearish reversal. It consists of three peaks: the middle peak (head) is higher than the other two (shoulders).As depicted in the image below.
- Trading Strategy: Traders typically look for a break below the neckline (support level connecting the two shoulders) to confirm the reversal.Visual Suggestion: An infographic illustrating the head and shoulders pattern with clear labeling of the head, shoulders, and neckline, alongside an example from a real stock chart.
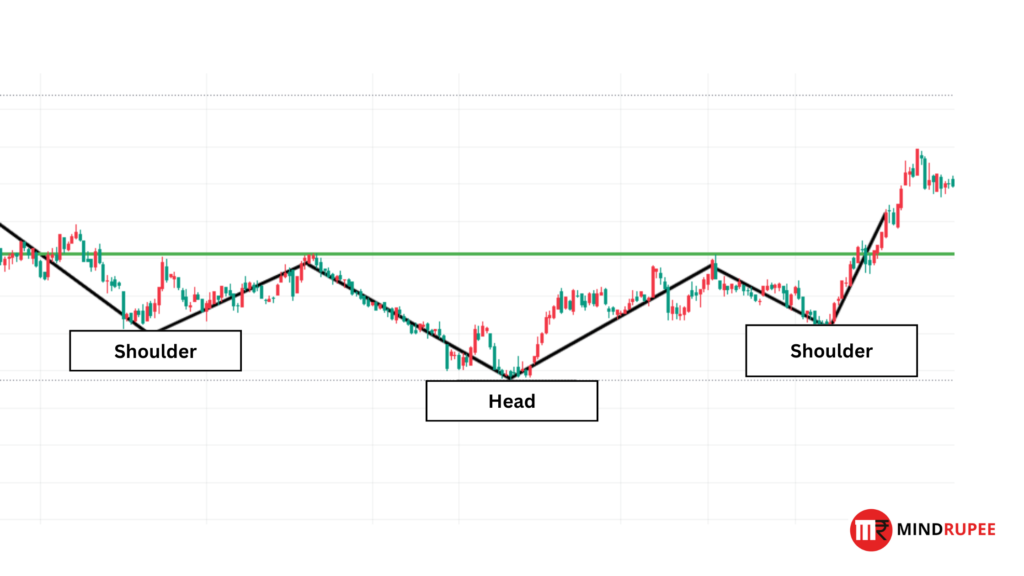
Inverse Head and Shoulders
- Description: This pattern is the opposite of the head and shoulders, signaling the end of a downtrend. It consists of three troughs, with the middle trough being the lowest.
- Trading Strategy: A breakout above the neckline signals a potential bullish reversal.Visual Suggestion: Display a side-by-side comparison of the head and shoulders and inverse head and shoulders patterns, emphasizing the reversal points.
Double Top
- Description: The double top pattern forms two peaks at nearly the same level, signaling a reversal from an uptrend to a downtrend.
- Trading Strategy: Traders enter short positions when the price breaks below the support level after the second peak.Visual Suggestion: Show a double top pattern with arrows highlighting the two peaks and the breakdown below the support line.

Double Bottom
- Description: The double bottom pattern forms two troughs at the same level, indicating a reversal from a downtrend to an uptrend.
- Trading Strategy: The pattern is confirmed when the price breaks above the resistance level formed between the two troughs.Visual Suggestion: Display an infographic showing a double bottom pattern, with annotations highlighting the entry points after the breakout.

Triple Top
- Description: A triple top pattern features three peaks at the same level and confirms a strong resistance level, indicating a bearish reversal.
- Trading Strategy: Traders wait for a break below the support level following the third peak to confirm the pattern.Visual Suggestion: An infographic showing the formation of three peaks, with a focus on the breakout below support.

Triple Bottom
- Description: This pattern shows three troughs at the same level, signaling a strong support level and a potential bullish reversal.
- Trading Strategy: Traders look for a breakout above the resistance formed between the troughs to confirm the pattern.Visual Suggestion: Create a triple bottom infographic, highlighting each trough and the breakout point.

Cup and Handle
- Description: This bullish continuation pattern resembles a cup with a small consolidation (handle) following the initial uptrend. After a brief consolidation, the price typically breaks out upward.
- Trading Strategy: Traders look to enter after the breakout from the handle for a strong bullish move.
Continuation Patterns
Continuation patterns indicate that a prevailing trend is likely to continue after a brief consolidation. These patterns are essential for swing traders who want to ride trends for longer.
Ascending Triangle
- Description: This bullish continuation pattern is characterized by a series of higher lows and a flat resistance line at the top. It indicates that buying pressure is building.
- Trading Strategy: Traders enter long positions when the price breaks above the resistance line..
Descending Triangle
- Description: This bearish continuation pattern forms a series of lower highs with a flat support line at the bottom. It indicates that selling pressure is increasing.
- Trading Strategy: Traders enter short positions when the price breaks below the support line.
Flags
- Description: The flag pattern represents a short-term consolidation within a strong trend. It looks like a small rectangle or flagpole after a significant price movement.
- Trading Strategy: Traders look for a breakout in the direction of the prevailing trend.
Range Consolidation Pattern
- Description: This pattern occurs when the price oscillates within a defined range (between support and resistance levels) before breaking out in either direction.
- Trading Strategy: Traders prepare for either a breakout above resistance for a bullish move or below support for a bearish move.
How to Plot Patterns in TradingView?
Using Drawing Tools
TradingView offers a wide variety of drawing tools to manually plot chart patterns. Here’s how to use these tools to identify and outline key chart patterns for swing trading:
- Trendlines: Use these to connect highs and lows in the market, helping identify patterns like triangles, head and shoulders, and flags.
- Horizontal Lines: These lines are great for marking support and resistance levels, making it easier to spot double tops/bottoms and range consolidation patterns.
- Shapes: Use shapes like rectangles or ellipses to highlight price zones that form patterns like the cup and handle or flags.
Customizing Your Chart
To enhance clarity and make it easier to identify chart patterns, follow these steps to customize your TradingView charts:
- Timeframes: Adjust the chart’s timeframe to match your swing trading strategy. For swing traders, using daily or 4-hour charts can provide a clear view of longer-term patterns.
- Chart Types: Use candlestick charts, which provide more detailed price action compared to line or bar charts. Candlestick patterns like the engulfing pattern and dojis complement chart patterns to refine trading decisions.
- Indicators: Add technical indicators like moving averages or the Relative Strength Index (RSI) to support pattern identification and make more informed trading decisions.
Setting Alerts for Patterns
TradingView allows users to set alerts when specific price conditions are met, automating parts of the trading process:
- Setting Price Alerts: You can set alerts for specific price levels that align with your chart patterns, like breakouts above a triangle’s resistance line or below a flag’s support line.
- Pattern Alerts: If using a more advanced TradingView plan, you can also set up automated pattern recognition, which will notify you when a pattern forms on your selected chart.
Combining Chart Patterns with Technical Indicators
RSI (Relative Strength Index)
The Relative Strength Index (RSI) is a momentum oscillator that measures the speed and change of price movements, typically ranging between 0 and 100. When used alongside chart patterns, the RSI helps confirm whether a market is overbought (above 70) or oversold (below 30).
- Application: For example, when identifying a double top or head and shoulders pattern, if the RSI shows overbought conditions, this confirms a potential bearish reversal. Similarly, in a double bottom pattern, an oversold RSI indicates a stronger likelihood of a bullish reversal.
MACD (Moving Average Convergence Divergence)
The MACD is a trend-following momentum indicator that shows the relationship between two moving averages of a stock’s price. When combined with chart patterns, MACD can confirm potential shifts in momentum that a pattern indicates.
- Application: When identifying a cup and handle pattern, a bullish MACD crossover (when the MACD line crosses above the signal line) can confirm the start of an upward trend. Conversely, in a descending triangle, a bearish crossover could validate a continuation of the downtrend.
Moving Averages
Moving averages smooth out price data to create a trend-following indicator. They are highly useful for confirming breakouts and trend reversals when used in conjunction with chart patterns.
- Application: If you spot an ascending triangle pattern, watch how the price behaves relative to a key moving average, like the 50-day or 200-day line. A breakout above the pattern’s resistance along with a moving average crossover strengthens the bullish signal.
Volume Analysis
Volume is a critical confirmation tool for validating chart patterns. High volume during a breakout or breakdown adds credibility to the pattern, showing that there’s conviction behind the move.
- Application: For instance, in a head and shoulders pattern, a breakout below the neckline with high volume confirms a stronger bearish move. Conversely, a cup and handle pattern followed by a breakout on high volume suggests a more robust upward trend.
Benefits of Using Chart Patterns in Swing Trading
Improved Entry and Exit Timing
One of the greatest advantages of chart patterns in swing trading is their ability to enhance timing precision for entries and exits. By recognizing specific formations, traders can anticipate market moves more effectively.
- Example: Identifying a double bottom allows traders to time their entry when the price breaks above the neckline, capitalizing on the beginning of an uptrend. Similarly, a head and shoulders pattern offers clear exit points as the price breaks below the neckline, signaling a potential trend reversal.
Visual Simplicity
Chart patterns provide a visually straightforward method for analyzing market movements, making them easier to grasp compared to more complex technical indicators. Traders can quickly recognize patterns like triangles, flags, or cup and handle formations, allowing for faster decision-making.
- Application: Swing traders don’t need to be bogged down by numerous calculations. A clear double top or triple bottom visually signals an impending reversal, simplifying the analysis process and making it easier to identify trade setups.
Applicable to All Markets
Another major benefit of chart patterns is their versatility. They work across various asset classes, whether you’re trading stocks, forex, commodities, or cryptocurrencies.
- Application: A bullish flag pattern in the stock market operates under the same principles in the forex market or with crypto assets. This consistency makes chart patterns a universal tool for traders, regardless of the market they’re in.
Common Mistakes to Avoid When Using Chart Patterns
Forcing Patterns
One of the most common errors traders make is forcing patterns into charts where none exist. This leads to poor decision-making and trading setups that don’t align with actual market conditions.
- Example: Misinterpreting random price movements as a head and shoulders pattern can lead to premature trades and unnecessary losses.
Ignoring Volume
Volume is crucial in confirming the strength of chart patterns. Traders often overlook this aspect, resulting in misinterpreting patterns. Without a significant increase in volume, the breakout or breakdown of a pattern may not hold, leading to false signals.
- Application: A triangle pattern that breaks out without accompanying volume may not sustain the move, indicating a potential trap for traders.
Not Considering the Bigger Picture
Relying solely on chart patterns without considering broader market trends can be dangerous. Patterns work best in conjunction with overall market conditions, and failing to account for this could lead to ineffective trades.
- Example: A bullish flag pattern in a bearish market might not perform as expected, and relying solely on it without factoring in market sentiment can result in a losing trade.
Practical Tips for Swing Traders Using Chart Patterns
Be Patient with Confirmations
It’s important to wait for proper confirmation before entering trades based on chart patterns. Entering too early can result in false breakouts or breakdowns.
- Tip: For patterns like double tops or ascending triangles, wait for the price to break key levels and confirm the trend before taking action.
Use Stop-Loss Orders
Protecting your capital is essential. Always place stop-loss orders just beyond the pattern’s breakout or breakdown point to limit potential losses if the trade goes against you.
- Example: In a head and shoulders pattern, placing a stop-loss just above the neckline can save you from unnecessary losses if the reversal doesn’t materialize.
Backtest Patterns
Before trading live, backtest your patterns using historical data to understand how well they work under different conditions. This helps in gauging their effectiveness and reliability.
- Tip: Use platforms like TradingView to test patterns such as double bottoms or flags over various time periods.
Adopt a Consistent Approach
Consistency is key. Stick to your strategy and avoid deviating from defined entry and exit points. Pairing chart patterns with solid risk management ensures long-term success.
- Example: Always wait for confirmation when trading cup and handle patterns, and consistently apply stop-loss rules to manage risks.
Chart patterns are powerful tools, but they must be combined with technical indicators and market analysis to enhance effectiveness.

