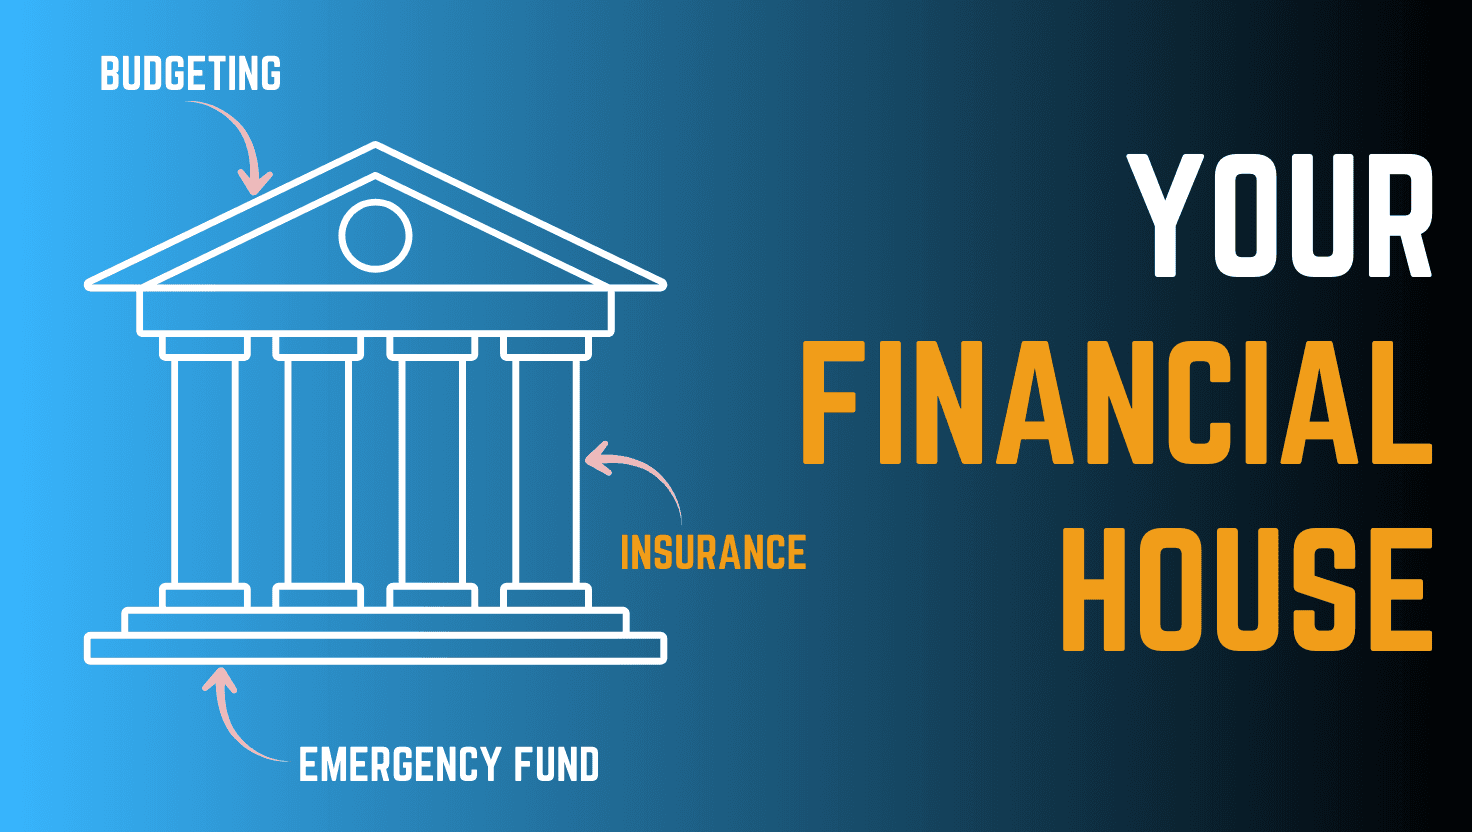
You are currently viewing Top 5 Flexi-Cap Funds in India | A 10-Year Performance Face-Off
Top 5 Flexicap Funds

Top 5 Flexi-Cap Funds in India | A 10-Year Performance Face-Off

Investing in flexi-cap mutual funds can feel like picking a team of all-rounders – these funds can invest across large, mid, and small-cap stocks at will.

Over a decade, some flexi-cap funds have delivered stellar growth and managed risk better than others.

In this comparison, we’ll chat about the top 5 flexi-cap funds (by 10-year performance) and see how they stack up in returns, risk-adjusted returns, and costs.

We’ll highlight who’s the overall risk-adjusted winner, who’s the short-term return champion, and which funds come with cautionary flags or hidden potential.

So grab a chai, and let’s break down the numbers!

If you have challenges with staying consistent with your investments. Read This!

Top 5 Flexi-Cap Funds in India

Understanding the Fund Metrics (Quick Primer)

Before we dive in, let’s demystify some key metrics we’ll be using, and how you can interpret them as an investor:

CAGR (Compound Annual Growth Rate)

This is the annualized return over a period (we’ll cite 3-year, 5-year, and 10-year CAGRs).

It tells you the fund’s average growth per year. Higher CAGR means better historical returns, but remember it’s backward-looking.

Alpha

Alpha measures a fund’s excess return over its benchmark index, i.e. how much value the fund manager added beyond just riding the market.

An alpha of +4% means the fund beat the benchmark by 4 percentage points (great!), while a negative alpha means it underperformed the index (not so great).

Higher alpha = manager outperformance.

Volatility

Often measured by standard deviation of returns, it indicates how much the fund’s returns swing around on average.

Higher volatility means more ups and downs – a bumpy ride.

A low-volatility fund is steadier. Look at volatility to know if a fund is aggressive or stable.

Sharpe Ratio

This tells us the return earned per unit of total risk (volatility) taken.

It’s a classic risk-adjusted return metric.

Higher Sharpe is better, meaning the fund delivered more return for each “unit” of risk taken.

A low or negative Sharpe means the return wasn’t worth the volatility (or even fell below the risk-free rate).

Sortino Ratio

A cousin of Sharpe, Sortino also measures risk-adjusted returns but focuses only on downside risk.

It ignores upside volatility and penalizes only harmful volatility (downturns).

A higher Sortino is good– it means the fund earned good returns without big downside swings.

If Sharpe and Sortino are both high, the fund managed risk very well; if they’re low or negative, tread carefully.

Expense Ratio

This is the fund’s annual management fee (% of your investment). It directly eats into your returns. Lower expense is always preferable (all else equal) because it means more of the fund’s gains end up in your pocket. Even a 1% vs 0.5% expense can make a difference over long periods due to compounding costs.

Keep these in mind as we compare our funds. Now, let’s meet the top five flexi-cap funds and see who shines where!

#1 Parag Parikh Flexi Cap Fund – The Risk-Adjusted Returns Champion

Parag Parikh Flexi Cap Fund (PPFCF) has become something of a legend for delivering consistent growth with lower volatility.

It’s the largest of the bunch (AUM over ₹1 lakh crore, indicating huge investor trust).

This fund is like the wise old friend who doesn’t brag the highest returns in every short-term sprint, but over the long haul it quietly wins the race with balance and prudence.

10-Year Performance

~18.3% CAGR over the past 10 years– among the top performers in absolute returns. It turned ₹100 into about ₹534 over decade (434% total growth). Not the very highest raw return, but very impressive given the lower risk it took. It also beat the category average (about ~14% for flexi-cap) by a wide margin showing strong stock selection.

Consistently Beats the Market

The fund’s alpha is ~4.9, the highest of all five. This means Parag Parikh Fund outperformed its benchmark index by nearly 5% annually on average – huge value-add by the fund manager. In other words, it generated extra returns beyond just riding the market upswing. (For context, in one study of 5-year data ending 2025, Parag Parikh and a couple of others were noted for ~4-5% outperformance while many peers couldn’t even beat the index)

Smooth Ride (Low Volatility)

The volatility of this fund is the lowest of the group (~10.4% standard deviation). It tends to fluctuate much less than its peers. It also had a smaller max drawdown (~31%) in rough markets, whereas others fell 40%+. Essentially, it has been much steadier. For you, this means fewer sleepless nights during market crashes – the fund falls less and recovers well.

Best Risk-Adjusted Return

Parag Parikh Flexi Cap boasts the highest Sharpe ratio, ~0.81, which is excellentgroww.in. That indicates it delivered the most return for each unit of risk among these funds. Its Sortino ratio is also positive (around 0.1). While that Sortino value isn’t huge, it is better than others (most peers had near-zero or negative Sortino). The takeaway: for the risk taken, this fund gave the best bang-for-buck in returns. It didn’t waste risk – volatility here has generally been the productive, rewarding kind.

Moderate Strategy

The fund is known for a balanced portfolio (even some global stocks) and a long-term focus. Top holdings concentration is moderate (~37% in top 5 stocks) – not overly concentrated, but not super spread out either. It strikes a good balance between conviction in top picks and diversification. Expense ratio is around 0.6%, reasonable for an actively managed equity fund of this size.

Why it’s the Winner

In simple terms, Parag Parikh Flexi Cap Fund gave investors nearly top-tier returns with much lower risk than others. High alpha plus high Sharpe indicates it excelled in risk-adjusted returns – exactly what long-term investors should crave. If you value consistency and efficiency over sheer thrill, this fund has been a star. It’s the classic case of the tortoise beating many hares: not always the fastest in short bursts, but over time it has delivered superbly for every unit of risk taken. No wonder many investors consider it a core flexi-cap holding.

(Fun fact: As of 2025, this fund became so popular it crossed ₹1 trillion in AUM – a testament to its success, though such size also brings new challenges in managing liquidity.)

#2 Quant Flexi Cap Fund – The High-Octane Short-Term Superstar (with Caveats)

Quant Flexi Cap Fund is the flashy sports car of our list.

In recent years, it has zoomed ahead of the pack with astonishing returns. If you just look at the past 5-year or even 10-year returns, Quant is #1 in raw performance.

But (and this is a big but) this speed comes with high risk and volatility, and an inconsistent long-term story.

Think of Quant Flexi Cap like a rollercoaster – thrilling and rewarding, but not everyone’s stomach is made for it!

Blistering Returns

This fund delivered about ~19.9% CAGR over 10 years, the highest among these five.

In fact, as per Moneycontrol data it turned ₹10k into over ₹62k in 10 years (522% total return)

Over 5 years, it clocked an eye-popping ~27–33% CAGR (depending on the exact period) – basically it nearly quadrupled money in 5 years, which is phenomenal.

By pure growth, Quant is the champ – it even outpaced the category average by a wide margin in returns (e.g. ~27% vs ~21% for 5-year, ~20% vs ~15% for 10-year).

Recent Outperformance vs Earlier Years

It’s important to note that Quant’s stellar performance has been a more recent phenomenon.

In the last 3–5 years, its agile strategy (the fund is known for dynamic sector rotation and momentum plays) paid off big time, giving it a huge 5-year alpha of ~10.5% – truly exceptional.

However, if you extend to a 10-year view, its alpha turns negative (~–1.45) in our data.

Huh? How can that be?

Essentially, the fund underperformed the benchmark in the earlier part of the decade, then massively outperformed in later years.

The early underperformance drags down its long-term alpha. So while the recent track record is brilliant, the full 10-year track includes a slow start. It underlines that Quant’s strategy might be more hit-or-miss over different market cycles.

Volatility & Drawdowns – Hold On Tight

This fund has the highest volatility (~16.5% standard deviation) among the five, and it shows.

In a market crash, Quant Flexi Cap can fall hard.

Its maximum drawdown was about –41%, meaning at one point it lost nearly 41% from a peak – roughly on par with the worst of the market.

In other words, it doesn’t shy from risk. During rough patches, expect a wild ride.

Over the long run, it has delivered great returns, but you had to survive some gut-churning drops. This is reflected in its Sharpe ratio, which is actually negative (~–0.65).

A negative Sharpe means that relative to a risk-free rate, the fund didn’t compensate for its high volatility. Similarly, its Sortino is negative too (indicating significant downside volatility not met by adequate upside).

What’s driving this?

Quant Flexi Cap tends to run a concentrated, sector-rotating portfolio.

It often makes bold bets (top 5 holdings concentration ~34%, fairly high). When those bets work, returns skyrocket; when they don’t, the fund can stumble.

It’s a “high reward, high risk” proposition. The fund’s expense ratio (~0.6%) is normal, so the volatility is not from cost – it’s truly from investment choices.

Investor Caution

For investors, the key is know your risk appetite.

If you invested 5 years ago, you’re probably ecstatic with Quant.

But you also needed to tolerate a lot of volatility on the way.

This fund is not for conservative investors or those who panic in downturns. It’s more suited for aggressive investors who understand market timing or at least won’t bail out at the first sign of trouble. It’s the kind of fund where you buckle up and hold on.

Also, keep an eye on consistency: a fund that was an underdog then a superstar might flip again. Past performance, especially outsized performance, may not sustain forever.

In summary, Quant Flexi Cap Fund is the short-term return leader – the sprinter that clocked the fastest speed. It can potentially continue to outperform, but be mindful of the rollercoaster risk.

The fund proves the point that “highest return” and “best fund” aren’t always the same.

High returns are exciting, but make sure you’re comfortable with how those returns are generated (and at what risk).

If you’re considering Quant, go in with eyes open and a strong stomach!

#3 HDFC Flexi Cap Fund – The Large, Reliable Veteran

HDFC Flexi Cap Fund is like the seasoned veteran on the team – a fund with a long history (one of the oldest flexi-cap funds) and a massive investor base. With an AUM around ₹75,000+ crore, it’s a giant in the category.

Over the last decade, HDFC Flexi Cap has delivered strong returns as well, nearly on par with our winners, while maintaining a relatively balanced risk profile. It might not be as flashy as Quant or as celebrated as Parag, but it’s a solid all-rounder worthy of attention.

Competitive Returns

HDFC Flexi Cap churned out ~16.3% CAGR over 10 years.

That’s a very healthy long-term growth rate – turning ₹1 lakh into ~₹4.5 lakh in a decade.

Its shorter-term numbers are even higher: ~28.5% CAGR for 3 years, ~30% for 5 years (thanks to a strong run in recent market rallies).

So it’s not far behind the top return getters. In fact, in the 5-year period ending 2025, HDFC Flexi Cap Fund was among the top flexi-caps, outperforming the benchmark by ~5.9% (alpha)– showing that the fund management added good value.

Alpha and Stock Picking

The fund’s alpha is around 4.6 over the long run, second only to Parag Parikh’s.

This confirms HDFC Flexi Cap has beaten its index by a solid margin historically.

It has a classic large-cap biased portfolio with some tactical mid/small-cap plays.

Their fund managers (HDFC AMC is a big name) have been able to generate excess returns through stock selection and sector allocation. So from an active management perspective, it has justified its fees with extra return.

Risk Metrics

One nice thing – HDFC Flexi Cap’s volatility (~11.8%) is quite low given its high returns.

It’s only a tad higher than Parag Parikh’s volatility, and notably lower than category average. It suggests the fund didn’t take excessive risk to achieve its returns – a mark of efficient management.

Its Sharpe ratio (~0.57) is decent (not as high as Parag’s, but much better than negative ones). Sortino ~0.06, also modestly positive.

These imply good risk-adjusted performance – not the very top, but certainly above average. Like Parag, HDFC Flexi Cap also handled downturns relatively well (max drawdown ~42%, which is on the higher side, but much of that was recovered quickly in subsequent rallies).

Portfolio Characteristics

HDFC Flexi Cap holds a diversified portfolio but with a bit of concentration in top holdings (~41% in top 5) – the highest concentration among these five.

That means the fund places big bets on its highest convictions (often blue-chips like large private banks, tech, etc.).

This hasn’t hurt it; those bets largely paid off. It also sticks mainly to domestic large and mid-caps.

The SEBI risk label is “Very High” (as with all equity flexi-caps), but in practice this fund has been more stable than many peers. Expense ratio is ~0.7% (direct plan), which is reasonable for a large fund.

In essence, HDFC Flexi Cap Fund is a strong contender that balances growth and stability. It may not grab headlines like the highest flyer, but it has consistently outperformed the market and many peers, with moderate risk.

For investors, it offers a bit of the best of both worlds – high long-term returns and a smoother journey than an aggressive fund. This makes it a worthy core holding for those who want a proven, “no surprises” flexi-cap fund. It’s like that reliable veteran player who you know will deliver when it counts.

(Note: HDFC Flexi Cap Fund was earlier known as HDFC Equity Fund – a flagship scheme with a pedigree. It had some years of underperformance around mid-2010s, but has since regained form, as the numbers show.)

#4 Edelweiss Flexi Cap Fund – The Low-Cost Hidden Gem

Not many casual investors talk about Edelweiss Flexi Cap Fund – and that’s exactly why we’ve dubbed it a “hidden gem.”

It’s the smallest fund in this top 5 list (AUM ~₹2,600 crore, which is tiny compared to giants like HDFC or Parag).

Yet, it has quietly put up an impressive show in performance metrics.

What’s more, it does so while charging a fraction of the fees of others. For cost-conscious investors looking for an up-and-comer with solid potential, Edelweiss Flexi Cap deserves a closer look.

Strong Returns, Slightly Under the Radar

Over 10 years, Edelweiss Flexi Cap delivered ~15.9% CAGR. That’s the lowest among the five funds here, but not by much – and still a very robust return. In the last 5 years it averaged ~26.5% CAGR, and ~25% in 3 years – so it’s very much in league with the bigger names in recent performance.

The fund has clearly benefited from some good stock picks and maybe a mid-cap tilt (we’d need to see its portfolio). Its returns have outpaced the benchmark by a healthy margin; alpha is about 3.5, which means it beat the index by 3.5% annually.

That’s not top of the class, but definitely commendable.

Ultra-Low Expense Ratio

One of the biggest attractions – the expense ratio is just 0.44% (for Direct Plan), which is lowest among these funds. Essentially, Edelweiss is managing the fund at near-index-fund cost!

This gives it a built-in advantage: it doesn’t have to outperform by as much to deliver similar net returns to investors. Lower costs = more of the returns go to you. Over long periods, this can add up. It’s cost-efficient, which often comes with smaller/newer funds trying to attract investors.

Diversification and Risk

This fund has the lowest concentration in top holdings (only ~25.7% in top 5 stocks). That suggests a very well-diversified portfolio.

Diversification can help reduce stock-specific risk – so even if one pick goes wrong, it doesn’t hurt the fund badly. The trade-off is you need more stocks to drive returns. So far, the strategy seems to be working. Edelweiss Flexi Cap’s volatility (~15.3%) sits in the middle – higher than Parag or HDFC, but lower than Quant/JM.

It had a maximum drawdown around 36%, which, while substantial, was a bit less severe than the worst hit funds. The Sharpe (~0.11) and Sortino (~0.01) are mildly positive, indicating it has provided marginally decent risk-adjusted returns – not exceptional, but at least it isn’t destroying value on a risk-adjusted basis.

Think of it as holding its own in the risk/reward department.

Why Call it a “Hidden Gem”?

Mainly because of its low AUM and low profile despite good metrics. Many investors simply haven’t noticed it.

A lower AUM can mean the fund is more nimble (easier to deploy in smaller companies without moving the market). It could also mean higher risk if the AMC is not as established – but Edelweiss MF is a well-known fund house in India’s finance circles, albeit smaller than HDFC or ICICI.

The fund’s track record now spans a decade, which adds credibility. Given its cost advantage, if it continues performing well, it might attract a lot more inflows. Early investors could benefit as the fund grows in recognition.

In summary, Edelweiss Flexi Cap Fund is like that underdog player with great per-match stats but not many fans watching. It offers impressive performance vs risk, and charges a bargain fee. For an investor, that’s an attractive combo. Of course, as with any smaller fund, one should monitor if performance sustains as it scales. But so far, so good! If you’re looking to add a flexi-cap fund that won’t cost you much and has the potential to shine, keep an eye on this one. Sometimes the best value is found off the beaten path.

#5 JM Flexicap Fund – High Returns with a Risk-Return Mismatch

JM Flexicap Fund is an interesting case of “great returns, but… at what cost?”.

This fund is actually the oldest in the flexi-cap category (launched way back, even older than HDFC’s). It went through a revival of sorts in recent years, posting very strong returns that put it near the top of the charts.

However, when we peel back the layers, the risk-adjusted metrics throw up red flags.

It appears JM Flexicap has been shooting the lights out in performance, but in a way that hasn’t been very efficient relative to risk. Let’s break down this paradox:

Eye-Popping Recent Returns

Make no mistake, JM Flexicap’s raw performance is superb. Its 3-year CAGR is ~29.1%, which was actually the highest among the five funds for that span (even above Quant’s 24.9% for 3Y).

The 5-year CAGR ~27%+ is also top-tier, and 10-year CAGR around ~17–18% is excellent. In fact, one ranking noted JM Flexicap Fund had the highest return among all flexi-cap funds over the last 10 years- an accolade that would catch any investor’s attention.

So, returns-wise, it’s proven it can deliver growth as well as (if not slightly better than) the big names.

The Underperformance Underneath

Despite those returns, JM Flexicap’s alpha is only ~0.3, essentially nil. This tells us that almost all of its performance can be explained by the market’s movement; it barely beat the benchmark.

That’s puzzling – how can a fund with 18% 10Y return not have much alpha?

It likely means the benchmark itself (maybe Nifty 500 or similar) did quite well, and JM’s strategy – perhaps heavy in momentum stocks – matched it but not significantly exceeded it.

In contrast, peers like Quant, HDFC, Parag have alphas between 4–5%. So JM didn’t really add a lot of unique value above the market, it simply rode the market wave (albeit aggressively).

Risk-Adjusted Blues

Now the big issue – Sharpe and Sortino ratios for JM Flexicap are negative. This is a major flag that the fund’s risk-return tradeoff has been poor.

A negative Sharpe means that considering its volatility, the fund’s excess returns over risk-free were actually not sufficient. In simpler terms, it took on a lot of risk (volatility ~16.3%, nearly as high as Quant’s) but didn’t deliver commensurate risk-adjusted returns.

Sortino being negative echoes the same concern: there was a lot of downside volatility that wasn’t compensated by enough upside.

So, while the absolute returns look great on paper, an investor in this fund likely endured some wild swings and periods of underperformance that made the ride rough relative to the outcome.

High Volatility & Drawdown:

The fund’s style seems aggressive (similar to Quant’s in some ways). It likely chases momentum and small/midcap opportunities, leading to high volatility.

It had drawdowns north of 40% in crashes. The ET Money analysis actually credited it as being good at “protecting against volatility”, which is a bit contradictory to the Sharpe/Sortino we see – perhaps they mean it recovers quickly or something.

But the numbers suggest you’d have felt the bumps investing in JM Flexicap.

What’s the mismatch?

In short, JM Flexicap gave very high returns but with even higher relative risk .

It’s like a race car that finished the race fast but used too much fuel and nearly spun out at every turn – it finished first, but not efficiently. Another way: If two funds both gave 18% returns, but one did so with smooth consistency and the other with huge ups/downs, the former has a better Sharpe (efficient), the latter has a worse Sharpe (inefficient).

JM is that latter case. It underperformed on risk-adjusted metrics even though it outperformed in raw returns.

Investor Implication

The caution here is for investors to not get blinded by the high past returns alone.

Sure, 29% 3-year gains are enticing, but ask: how were those returns achieved? If by swinging for the fences, there’s a chance the luck might not hold.

The fund’s strategy (possibly momentum-driven) could falter in different market conditions. Already we saw it had a –9.8% return in the last 1 year (as of 2025), showing it can hit rough patches.

So, treat JM Flexicap as a high-risk, tactical play, not a core stable holding. If you invest, be ready for the rollercoaster and have the discipline to ride through or cut out when needed.

In summary, JM Flexicap Fund is a high-return fund that comes with strings attached.

It exemplifies a risk-return mismatch: delivering good returns but not in a risk-efficient manner. For thrill-seekers, it may still appeal – it did technically make more money than many peers.

But prudent investors will want to carefully weigh if those extra percentage points of return are worth the extra headache and risk. Often, a fund like Parag Parikh (18% return with smooth ride) might be preferable to JM (18% return with whiplash), even if the end-point returns look similar. Always balance return with risk!

Conclusion: Balancing Performance, Risk, and Cost in Your Selection

After chatting through these five funds, one thing should stand out: there’s no one-size-fits-all “best” fund.

It really depends on what you as an investor value and can tolerate:

  • If you want stellar returns and don’t mind high risk, a fund like Quant Flexi Cap or JM Flexicap might intrigue you – but be prepared for a bumpy journey and do your homework. They can reward handsomely, but require a strong stomach (and maybe a close watch on market trends).
  • If you prioritize steady, risk-adjusted performance, Parag Parikh Flexi Cap fund has proven itself a winner. It’s shown that sometimes slightly lower raw returns with much lower volatility actually win out in the long run. HDFC Flexi Cap fund also fits here as a reliable performer with balanced risk – a great choice if you want growth with a bit of peace of mind.
  • For those looking at upside potential and low costs, Edelweiss Flexi Cap is worth consideration. Its low expense ratio means it’s easier for this fund to outrun peers (since it’s not dragged by fees). It’s smaller but has delivered solid results – a good dark horse candidate to add diversification to your portfolio.

No matter which fund(s) you lean towards, remember these practical takeaways:

  • Look beyond just 10-year CAGR. Also compare alpha (did the fund beat the market?), Sharpe/Sortino (was it efficient in doing so?), and volatility/drawdowns (can you live with the swings it had?). A fund that made 18% with fewer hiccups is arguably better than one that made 19% but gave you heartburn every year.
  • Match the fund to your risk appetite. If you’re a conservative or first-time investor, a high-volatility fund, no matter how high the return, may cause you to panic-sell at the worst time. It might be wiser to pick a slightly more stable fund. On the other hand, if you’re young or aggressive and understand market cycles, taking on a Quant or JM in moderation could boost your overall portfolio returns (just position size it wisely).
  • Costs matter in the long run. An expense ratio difference of 0.5% might sound small, but over 10+ years it compounds away a chunk of your money. All else equal, go for the cheaper fund. In our list, Edelweiss was notably cheap, HDFC/Parag in mid range, and none were exorbitant. But always check the latest expense ratio – they can change.
  • Diversify and monitor: Even within flexi-cap funds, you can diversify (they sometimes have different strategies – e.g., one may be value-oriented, another growth-oriented). And keep an eye on performance periodically. If a fund’s strategy or management changes, its future may not mimic its past. For instance, if one of these high-fliers starts lagging or taking on too much risk, you might reconsider your investment.

In investing, balance is key. The top-performing fund of the last decade might not be the top of the next – but a fund that has shown a good balance of return and risk is likely to serve you well over time.

Use metrics like Sharpe and Sortino to judge that balance (a quick rule: higher Sharpe = better risk-adjusted return, higher Sortino = better downside protection). Use alpha to ensure you’re not just paying for index-like performance. And always align with your personal goals and comfort.

To conclude all these funds have made investors money and have their own fan followings.

Choosing among them is like choosing a vehicle for your journey – a speedy sports car, a safe sedan, a cost-efficient bike, etc.

What matters is reaching your destination (financial goals) safely and enjoyably.

Pick the fund that lets you sleep at night while still moving you toward your goals. Happy investing, and may your portfolio always find the right balance between performance, risk, and cost.